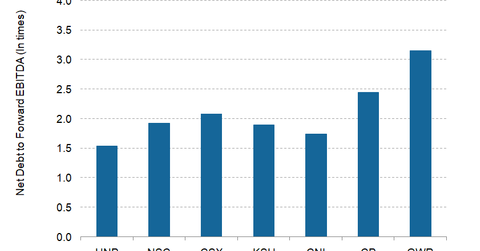
Evaluating Leverage Levels of Major Railroads after Q1 2018
As of March 31, Genesee & Wyoming (GWR) had a net debt-to-forward-EBITDA multiple of 3.2x, which was much higher than the industry average of 2.1x.
Dec. 4 2020, Updated 10:53 a.m. ET

US railroads’ leverage levels
In the previous part of this series, we looked at major US railroads’ capex levels. Now we’ll check their leverage ratios after their first-quarter results. Railroads (IYJ) are an extremely capital-intensive industry with major investments in locomotives, rolling stock, locomotives, and new track. They need external funds to support their huge investments in tangible assets. Since it is a cyclical industry, higher debt levels work in railroads’ favor in times of economic upturns. However, when business prospects are dim, increased debt levels become a matter of concern.
Net debt-to-forward EBITDA ratio
For the purpose of evaluating the debt levels of major US railroads, we’ve used the net debt-to-forward-EBITDA multiple. Net debt is the excess of total debt over cash and cash equivalents. EBITDA refers to earnings from core operations. This metric focuses on the debt-servicing ability of a railroad through EBITDA. Since Burlington Northern Santa Fe Railway (BRK-B) is a privately owned Class I railroad in the United States, we haven’t included the company for our discussion on debt levels.
Why GWR has the highest metric
By looking at the above graph, you can see that the net debt-to-forward-EBITDA multiple is the highest for Genesee & Wyoming (GWR). As of March 31, it had a metric of 3.2x, which was much higher than the industry average of 2.1x. It had a net debt of $2.2 billion with a forward EBITDA of $720.1 million at the end of the first quarter. The slow pace of GWR’s EBTIDA growth, as well as acquisitions, resulted in higher debt levels for the company.
Which railroad follows GWR?
GWR is followed by Canada’s second-largest rail carrier, Canadian Pacific Railway (CP). CP has a metric of 2.4x, a net debt of 8.2 billion Canadian dollars, and EBITDA of 3.3 billion Canadian dollars at the end of the first quarter. CP’s debt levels have been higher for quite some time, although it has reduced its debt burden in recent quarters.
Eastern US rail giant CSX (CSX) ranked third in terms of net debt-to-forward-EBITDA ratio. The railroad has a metric of 2.1x, implying $11.7 billion in net debt and EBITDA of $5.6 billion. Norfolk Southern (NSC) has the same metric of 1.9x, which is just below CSX’s multiple. Next is Kansas City Southern (KSU) and Canadian National Railway (CNI) with metrics of 1.9x and 1.7x, respectively.
Western US major railroad Union Pacific (UNP) has the lowest net debt-to-forward-EBITDA multiple of 1.5x in the peer group. It’s worth noting that given the railroad’s size of operations, maintaining the lowest leverage metric is a significant achievement.
In the next part of this series, we’ll compare the major US railroads’ dividends in 2018.
