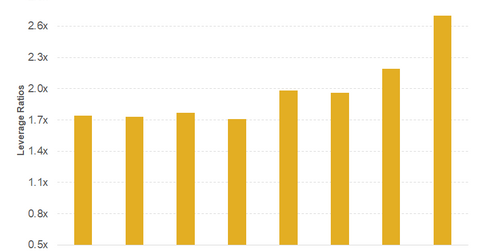
A Look at General Motors’ Debt Levels
At the end of 4Q17, General Motors’ debt-to-equity ratio was 2.7x.
April 24 2018, Updated 10:30 a.m. ET

Auto sector
The automobile industry is a capital-intensive sector due to huge fixed and raw material costs involved in the manufacturing process. This is one of the key reasons that major automakers (VCR) such as General Motors (GM), Ford (F), Toyota (TM), and Fiat Chrysler (FCAU) extensively utilize debt.
In this part, we’ll take a closer look at GM’s leverage position before its 1Q18 earnings release.
Debt-to-equity ratio
At the end of 4Q17, General Motors’ debt-to-equity ratio was 2.7x. The debt-to-equity ratio reflects the amount of debt involved in a company’s total capital structure. A high debt-to-equity ratio means that the company might need to borrow more funds to drive growth in the near future.
GM’s debt-to-equity ratio was significantly lower than that of competitor Ford Motor Company’s 4.4x at the end of 4Q17. While higher leverage can magnify a company’s return on equity, it can also squeeze margins as interest rates rise.
Net-debt-to-EBITDA
At the end of 2017, GM’s net debt-to-EBITDA (earnings before interest, tax, depreciation, and amortization) stood at 2.6x. GM’s ratio was also better than Ford’s 7.7x.
A high debt position increases a company’s risk profile, as debt is a contractual obligation that the company must fulfill regardless of market conditions. As a result, investors should pay attention to an auto company’s leverage position.
Next, let’s find out how GM’s valuation multiples are trending before its 1Q18 earnings release.
