What Do Mining Stocks’ Technicals Indicate?
Many of the fluctuations in precious metals have been a result of speculation about the Federal Reserve’s interest rate stance.
Nov. 18 2016, Published 2:44 p.m. ET

Precious metal funds
Many of the fluctuations in precious metals have been a result of speculation about the Federal Reserve’s interest rate stance. In this article, let’s look at the fundamentals of South African precious metal miners.
Precious-metal-based funds such as the Sprott Gold Miners (SGDM) and the Global X Silver Miners Fund (SIL) have seen their returns fall in the past few months. On a trailing-30-day basis, these two funds have fallen 5.3% and 7.9%, respectively, although they’ve risen year-to-date.
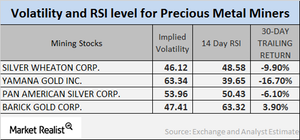
Let’s look at the implied volatilities of giant mining stocks and their RSI (relative strength index) levels in the wake of the carnage in precious metal prices. We’ll look at New Gold (NGD), Silver Wheaton (SLW), Cia De Minas (BVN), and Hecla Mining (HL).
Implied volatility
Call implied volatility takes into account the changes in an asset’s price due to variations in the price of its call option. During times of global and economic turbulence, volatility is higher than it is in a stagnant economy. The volatilities of New Gold, Silver Wheaton, Cia De Minas, and Hecla were 67.5%, 56.4%, 58.8%, and 66.3%, respectively, on November 14, 2016.
RSI
The RSIs (relative strength indexes) for each of these four mining giants fell due to their falling share prices. New Gold, Silver Wheaton, Cia De Minas, and Hecla saw RSI levels of 38.2, 26, 35.5, and 47.3, respectively.
The trailing-30-day returns of most of the mining companies are negative due to the diminishing safe-haven appeal of precious metals.
