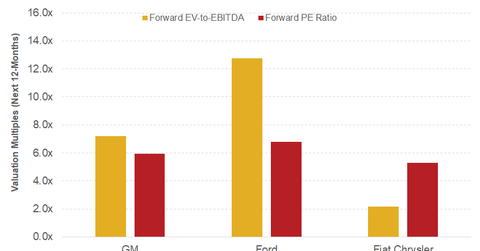
How US Auto Companies’ Valuation Multiples Look in March 2018
On March 8, 2018, GM’s EV-to-EBITDA was 7.2x, much lower than its direct competitor Ford’s multiple of 12.8x.
Nov. 20 2020, Updated 1:47 p.m. ET

Analysts on US auto stocks
In the previous part of this series, we explored how Wall Street analysts are rating the two largest US auto companies, General Motors (GM) and Ford Motor Company (F). A higher percentage of Wall Street analysts have been favoring “buys” and a higher upside potential on GM stock compared to Ford stock in the last few months.
Consistent improvements in GM’s profitability and its exit strategy from loss-making market segments could be some of the reasons for analysts’ positive views on its stock. Let’s move on by comparing the forward valuation multiples of these two US auto companies.
US automakers’ valuation multiples
We’ll begin by looking at US auto companies’ forward EV-to-EBITDA (enterprise value to earnings before interest, tax, depreciation, and amortization) multiples. On March 8, 2018, GM’s EV-to-EBITDA was 7.2x, much lower than its direct competitor Ford’s multiple of 12.8x.
These forward EV-to-EBITDA multiples are based on the expected next-12-month EBITDAs of these US auto companies.
Likewise, GM’s forward PE (price-to-earnings) multiple was 5.9x, lower than Ford’s 6.8x.
Among all mainstream automakers, Fiat Chrysler Automobiles (FCAU) had the lowest EV-to-EBITDA multiple of 2.2x and forward PE multiple of 5.3x.
Interestingly, the valuation multiples of Italian luxury carmaker Ferrari (RACE) are typically much higher than those of mainstream auto companies. This difference could be because Ferrari’s profit margins are significantly higher than those of its peers. In addition, Ferrari’s business model involves lower risk compared to the risk profiles of other mainstream automakers.
Key factors to watch in 1Q18
In 2015 and 2016, US auto companies (FXD) saw good times due to record light vehicle sales in the United States. While total US auto sales witnessed a minor fall of 1.8% YoY (year-over-year) in 2017, higher US truck and utility vehicle demand kept investor optimism alive.
After positive YoY growth in January 2018 US sales data, weak February data fueled investors’ concerns about the future of US auto sales. A consistent fall in US vehicle sales could move auto companies’ future earnings estimates downward, which could also drive their valuation multiples lower.
Be sure to visit our Autos page for the latest updates on auto companies and their earnings reviews.
