How CenturyLink’s Valuation Compares
As of March 16, 2018, AT&T (T) was the largest US telecom player, with a market capitalization of ~$227.2 billion.
March 26 2018, Updated 9:02 a.m. ET

CenturyLink’s scale
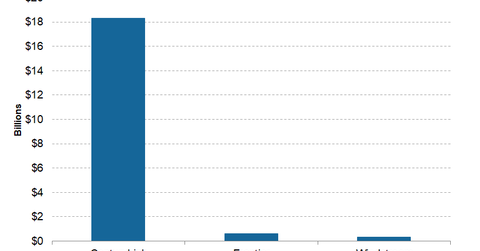
As of March 16, 2018, AT&T (T) was the largest US telecom player, with a market capitalization of ~$227.2 billion, followed by Verizon (VZ) at ~$198.1 billion. In the US wireline space, CenturyLink (CTL) had a market capitalization of ~$18.3 billion. Windstream (WIN) and Frontier (FTR) had market caps of ~$0.3 billion and ~$0.6 billion, respectively.
Bollinger Band
On March 16, CenturyLink stock closed at $17.13, near its lower Bollinger Band level of $16.94, suggesting the stock is oversold.
CenturyLink’s forward valuation
EV-to-EBITDA (enterprise value to earnings before interest, tax, depreciation, and amortization) multiples are often used for valuing telecom companies such as CenturyLink. As of March 16, 2018, CenturyLink was trading at a forward EV-to-EBITDA multiple of ~6.2x, whereas Windstream and Frontier had multiples of ~5.6x and ~5.3x, respectively.
Short interest ratio
As of March 16, 2018, CenturyLink stock’s short interest as a percentage of shares outstanding (or short interest ratio) was ~5.9%. Generally, a short interest ratio above 40.0% suggests a possible stock price correction.
