A Look at Comcast’s Strategy
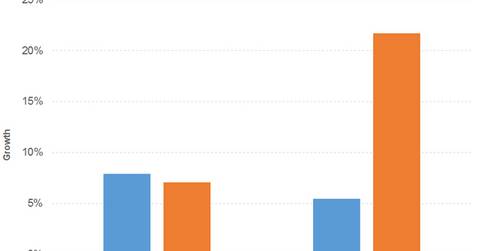
Comcast’s (CMCSA) revenue grew 8% and 5% in 2016 and 9M17, respectively. The broadcast of the Rio Olympics in 3Q16 drove the 2016 numbers.
Jan. 25 2018, Updated 4:05 p.m. ET

What drove Comcast’s revenue?
Comcast’s (CMCSA) revenue rose 8% and 5% in 2016 and 9M17, respectively. The broadcast of the Rio Olympics in 3Q16 drove the 2016 numbers. NBCUniversal, Cable Networks, Broadcast Television, and Theme Parks posted growth in 2016, offset by the Filmed Entertainment segment.
Theme Parks and Filmed Entertainment drove growth in 9M17, offset by the rest.
What drove diluted EPS?
Comcast’s cost of revenue rose 8% in 2016 and 3% in 9M17. Higher video programming costs drove the costs in 2016. Gross profit grew 8% and 6% in 2016 and 9M17, respectively. Operating expenses increased 9% and 5% in 2016 and 9M17, respectively. That led to a 5% and 10% growth in operating income for 2016 and 9M17, respectively. The hurricanes in late 2017 affected Comcast’s operations. Total interest and other expense outweighed other income, which remained flat in 2016 and 9M17. As a result, diluted EPS (earnings per share) rose 7% and 22% in 2016 and 9M17, respectively. Share buybacks enhanced the EPS numbers.
Dividend yield and price performance
Comcast has maintained an impressive free cash flow position. Its dividend yield was cut in half in 2017 due to a dividend cut and price gains.
Its dividend yield of 1.5% and PE (price-to-earnings) ratio of 23.8x compare to a sector average dividend yield of 2.2% and a PE ratio of 25.0x. Comcast rose 22%, 16%, and 6% in 2016, 2017, and YTD (year-to-date), respectively.
Going forward
Last year, Comcast witnessed the culmination of America’s biggest 4G (fourth-generation) LTE (Long-Term Evolution) network and a major Wi-Fi network. Comcast also entered into an agreement with Charter to explore operational efficiencies in the wireless market.
ETFs
The Vanguard Consumer Discretionary ETF (VCR) has a PE ratio of 24.6x and a dividend yield of 1.1%. The Fidelity MSCI Consumer Discretionary ETF (FDIS) has a PE ratio of 20.9x and a dividend yield of 1%.
