Fiat Chrysler Stock Began 2018 with a Bang after a Solid 2017
Last week, Fiat Chrysler stock (FCAU) continued to soar and posted solid weekly gains of 7.4%.
Jan. 17 2018, Updated 7:31 a.m. ET

Fiat Chrysler stock
Last week, Fiat Chrysler stock (FCAU) continued to soar and posted solid weekly gains of 7.4%. In the previous week, the stock also rose by about 22%. In 2017, the S&P 500 Index (SPY) (SPX-INDEX) rose 19.4%, while FCAU inched up by about 96.4%. After showcasing minor weakness in the previous two months, the company’s stock turned positive again in December last year. Let’s take a look at some recent developments related to Fiat Chrysler.
December US sales
In December 2017, FCAU’s US sales fell for the 16th month in a row and were down 11% YoY (year-over-year). The company continued to cut its US fleet sales aggressively last month, which drove its fleet sales down by 42% YoY. At the same time, the Italian-American giant reported a 3% YoY decline in its US market retail sales. FCAU’s strategy to focus on more profitable retail sales and cut fleet sales has helped it to improve its profit margins in the last few quarters.
In 3Q17, Fiat Chrysler reported a 25% YoY (year-over-year) rise in its earnings per share to 0.59 euros (~$0.70). Investors’ high expectations from the company’s 4Q17 results could be one of the primary reasons why its stock is continuing to soar in 2018 so far. According to a recent Reuters report, FCAU plans to move its Ram pickup truck production to Michigan from Mexico. This step is likely to add about 1,500 new jobs in the US where the company plans to invest $1 billion.
Support and resistance levels
As of January 12, Fiat Chrysler stock was maintaining impressive 31.1% YTD (year-to-date) gains against the S&P 500 benchmark’s 4.2% YTD gains (SPY) (SPX-INDEX). FCAU’s YTD performance was also far better than other auto companies including (IYK) General Motors (GM), Toyota (TM), and Ford (F). GM, TM, and Ford have gained 7.5%, 7.9%, and 5.9%, respectively, on a YTD basis.
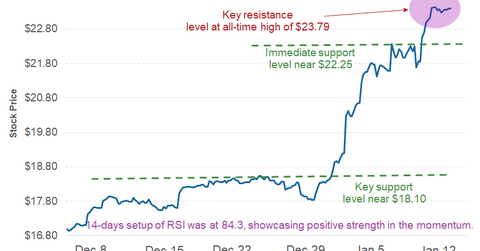
Fiat Chrysler stock settled at $23.39 on Friday last week and posted its all-time high of $23.79. This all-time high should act as an immediate resistance in the coming weeks, and a violation of this could attract fresh buying. An immediate support level lies at $22.25 on the downside.
On the daily price chart, the 14-day RSI (relative strength index) indicator was deep in the overbought territory at 84.3, which indicates strength in momentum.
Continue to the next part where we’ll look at Tesla stock’s recent price action.
