Are Oil ETFs Outperforming Oil?
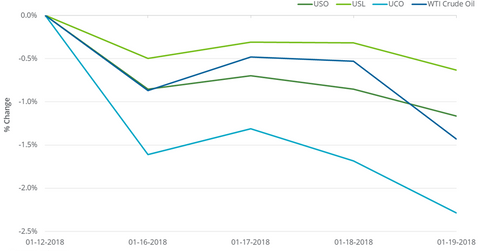
Between January 12 and January 19, 2018, the United States Oil ETF (USO) fell 1.2%.
Jan. 22 2018, Updated 11:05 a.m. ET

ETFs with exposure to oil
Between January 12 and January 19, 2018, the United States Oil ETF (USO) fell 1.2%. This fall was 20 basis points less than US crude oil March futures’ fall between these two dates.
The United States 12 Month Oil ETF (USL) and the ProShares Ultra Bloomberg Crude Oil ETF (UCO), other ETFs that have exposure to US crude oil futures, fell 0.6% and 2.3% in the last week, respectively. UCO’s large fall makes sense because it is meant to double the daily changes of the Bloomberg WTI (West Texas Intermediate) Crude Oil Subindex. USL holds US crude oil futures contracts for each month of delivery until February 2019.
Performance analysis since 2016
Between February 11, 2016, and January 19, 2018, US crude oil (DBO) (OIIL) active futures gained 141.8% after their 12-year low on February 11. The returns of oil-tracking ETFs during this time period are as follows:
- USO: 59.2%
- USL: 54.9%
- UCO: 100.8%
This difference in the returns of these ETFs versus US crude oil futures could be because of the “roll yield.” If active futures are priced below the following month futures contract, this roll yield would be a cost for these ETFs.
In addition to this, the compounding effect of UCO’s daily moves could drive the difference between UCO’s actual and expected returns.
However, as of January 19, 2018, US crude oil futures’ closing prices for contracts until February 2019 were in a descending pattern, which would be an advantage for these ETFs.
