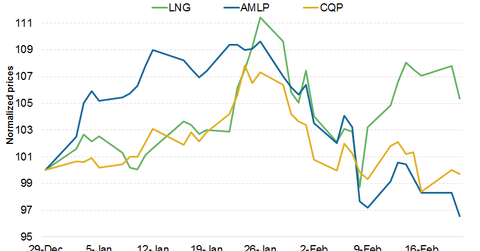
Cheniere Energy Stock after Its 4Q17 Earnings
Cheniere Energy is trading 4.4% above its 50-day simple moving average and 18.0% above its 200-day simple moving average.
Feb. 23 2018, Updated 1:25 p.m. ET

Cheniere Energy’s market performance
Cheniere Energy’s (LNG) shares received a positive market reaction. The shares rose ~1.0% in the early trading session the day after the earnings announcement. Overall, the stock has risen ~5.0% in 2018 despite a weak start to the month. At the same time, Cheniere Energy’s subsidiaries, Cheniere Energy Partners (CQP) and Cheniere Energy Partners LP Holdings (CQH) have gained 1.6% and 0.7%, respectively. The Alerian MLP ETF (AMLP) has lost 3.4% during the same period.
Moving averages
Currently, Cheniere Energy is trading 4.4% above its 50-day simple moving average and 18.0% above its 200-day simple moving average. There’s bullish sentiment in the stock. The higher 2018 earnings guidance, recent sale and purchase agreements, and positive FID on Train 3 at Corpus Christi could drive the company’s stock performance. A decline in LNG prices and global LNG demand could push Cheniere Energy below its historical moving averages, which would result in bearish sentiment.
Price forecast
Cheniere Energy’s 30-day implied volatility was 30.9% as of February 21, 2018, which is significantly lower than the 15-day average of 36.5%. Based on its current implied volatility, Cheniere Energy might trade in the range of $55.43–$60.39 in the next seven days. Cheniere Energy is expected to trade within this range with a 68.0% probability using a standard deviation of one and assuming a normal distribution of prices.
Next, we’ll discuss analysts’ recommendations for Cheniere Energy.
