TEVA Depends on This for Revenue Growth
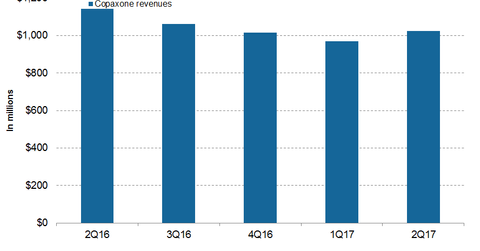
In 1H17, Teva Pharmaceutical’s (TEVA) Copaxone reported revenues of ~$2.1 billion, or ~7% lower YoY (year-over-year).
Sept. 14 2017, Updated 7:39 a.m. ET

Copaxone’s revenue trends
In 1H17, Teva Pharmaceutical Industries’ (TEVA) Copaxone reported revenues of ~$2.1 billion, or ~7% lower YoY (year-over-year). In 2Q17, Copaxone generated revenues of ~$1.0 billion, or ~10% lower YoY and ~5% higher QoQ (quarter-over-quarter).
Regional revenue trends
In 2Q17, in the US, Copaxone generated revenues of ~$843 million, compared with $955 million in 2Q16. In 2Q17, outside the US, Copaxone generated revenues of ~$180 million, compared with $186 million in 2Q16. The decline in sales volumes of Copaxone 20 mg in the US caused the decline in revenues in 2Q17. In 2Q17, the US contributed to ~82% of worldwide net Copaxone revenues, compared with ~84% in 2Q16.
In 2Q17, in US and European markets, more than 85% and 75% of Copaxone prescriptions, respectively, were with the 40 mg/ml version. The patients’ and physician’s choice of Copaxone 40 mg/ml primarily caused the high demand for this version.
TEVA’s US Orange book patents shielding the 20 mg/ml version of Copaxone expired in May 2014, while in the rest of the world, Copaxone 20 mg/ml patents expired in May 2015. Teva’s key business strategy for Copaxone is to maintain patients on the three-times-a-week 40 mg/ml version.
In 2Q17, Copaxone contributed to ~18% of TEVA’s net revenues. Copaxone (glatiramer acetate injection) is used for the treatment of individuals with relapsing forms of MS (multiple sclerosis).
TEVA’s peers include Novartis (NVS), Biogen (BIIB), Sanofi (SNY), and Bayer. Notably, the Market Vectors Pharmaceutical ETF (PPH) has ~2.58% of its total portfolio holdings in TEVA.
