How Vornado Stacks Up against Peers
Vornado’s recent development and redevelopment activities have made investors optimistic about the stock.
Aug. 7 2017, Updated 9:06 a.m. ET

Which valuation multiple should be used?
The performance of Vornado Realty Trust in 2Q17 can be evaluated with the help of the price-to-FFO (funds from operations) multiple. This multiple measures what investors have to pay in order to get a certain amount of earnings. It has the same significance as the PE (price-to-earnings) ratio for companies in other industries.
Price-to-FFO multiple
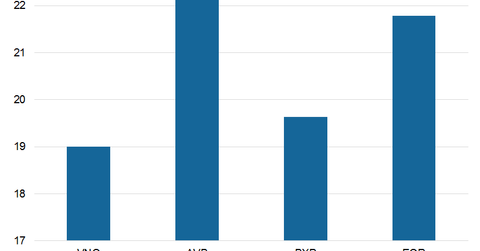
VNO’s current price-to-FFO multiple is 19x. Vornado’s recent development and redevelopment activities have made investors optimistic about the stock. The company has repositioned its properties in New York, which is seeing ample job growth and high demand for office and retail space. These factors likely triggered the price rally of its stock, thus pushing the multiple higher.
In terms of price-to-FFO multiple, VNO trades on par with most of its peers like AvalonBay Communities (AVB), Boston Properties (BXP), and Equity Residential (EQR), which are trading at price-to-FFO multiples of 22.4x, 19.64x and 21.79x, respectively.
Peer group dividend yield
Vornado offers a next-12-month (or NTM) dividend yield of 3%. Its close competitors like AvalonBay Communities (AVB), Boston Properties (BXP), and Equity Residential (EQR) offer dividend yields of 3%, 2.5%, and 3%, respectively.
Vornado and its peers make up 12.4% of the iShares Cohen & Steers REIT ETF (ICF). ICF’s net asset value stands at $101.14 per share.
