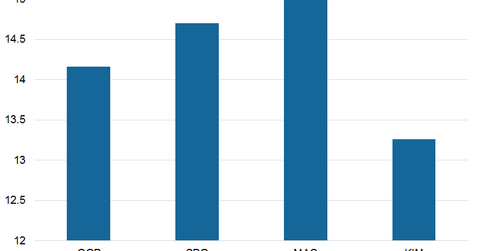
How GGP Stacks Up against Its Peers after 2Q17
GGP’s estimated price-to-FFO multiple for fiscal 2018 is 14.2x, which is at a premium compared to its peers.
Aug. 10 2017, Updated 9:05 a.m. ET

Price-to-FFO multiple
GGP’s (GGP) performance in 2Q17 can be best evaluated by a price-to-FFO (funds from operations) multiple. The ratio, which holds the same implication as the PE (price-to-earnings) multiple among other industries, gives an idea of how much an investor has to pay per share for the company to generate a per-share profit.
Peer group price-to-FFO multiple
GGP’s estimated price-to-FFO multiple for fiscal 2018 is 14.2x, which is at a premium compared to its peers. The company reported mixed results in 2Q17. It has also taken up several sales-boosting initiatives such as expanding its properties to high-demand localities with prospects of income growth. Optimistic guidance provided by the company has also triggered a spike in its prices, thus pushing the ratio higher.
However, in terms of price-to-FFO multiple, the company is trading at par with peers such as Macerich (MAC), Simon Property Group (SPG), and Kimco Realty (KIM), which are trading at multiples of 15.03x, 14.71x, and 13.26x, respectively.
The iShares Cohen & Steers REIT (ICF) invests 13.0% in the above REITs and has a year-to-date return of 4.1%.
Other important valuations
GGP currently has an EV-to-EBITDA (enterprise value to earnings before interest, tax, depreciation, and amortization) of 21.48x. Its peers MAC, SPG, and DDR have EV-to-EBITDA ratios of 22.38x, 18.34x, and 18.96x, respectively.
In terms of a forward (next 12-month) PE ratio, GGP trades at 13.88x, MAC trades at 14.58x, SPG trades at 13.90x, and KIM trades at 12.81x.
