Comparing the Valuations of 3 Leading Self-Storage REITs after 2Q17
Public Storage (PSA) trades at an EV-to-EBITDA multiple of ~21.5x.
Aug. 25 2017, Published 9:33 p.m. ET

Which multiples do REITs use?
To get an estimate about how the self-storage REITs could perform for the rest of the year, the price-to-FFO multiple serves as a useful tool. The price-to-FFO multiple indicates how much an investor pays for each unit of profit.
The price-to-FFO multiple carries the same implication as the price-to-earnings ratio of companies operating in other industries.
Price-to-FFO multiple
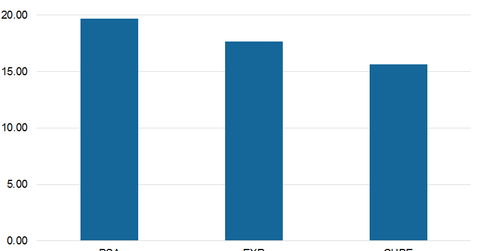
Public Storage (PSA) trades at a price-to-FFO multiple of 19.7x. The company has reported higher-than-expected results in 2Q17. PSA is carrying out several expansionary initiatives to maintain its leadership in the industry. Plus, Public Storage paid higher dividends during 2Q17. These factors have made investors optimistic about the stock.
Extra Space Storage (EXR) trades at a price-to-FFO multiple of ~17.6x. The company reinstated its guidance for fiscal 2017 and is expected to report a higher profit for the year. Extra Storage surpassed both goals a year ago.
EXR also surpassed analysts’ estimates for revenues and FFO during 2Q17 backed by higher margins, a decent occupancy level, and prudent cost-control measures by the company.
CubeSmart (CUBE) trades at a multiple of ~15.6x. The properties of CubeSmart are well positioned to tap the growing demand for storage facilities in Class A cities. CubeSmart also reported higher-than-expected results during 2Q17.
EV-to-EBITDA multiple
Public Storage (PSA) trades at an EV-to-EBITDA[1. enterprise value to earnings before interest, tax, depreciation, and amortization] multiple of ~21.5x. PSA stock trades at a premium to the other two self-storage REITs included in our survey—EXR and CUBE, which trade at EV-to-EBITDA multiples of ~20.2x and 18.2x, respectively.
EXR, PSA, CUBE, and Equity Residential (EQR) comprise more than 10% of the Vanguard REIT ETF (VNQ). VNQ has a trailing-12-month price-to-earnings ratio of ~7.5x.
In the final part of this series, we’ll look at the capital deployment strategy of these three REITs.
