How Does 3M Company Compare to Its Industrial Peers?
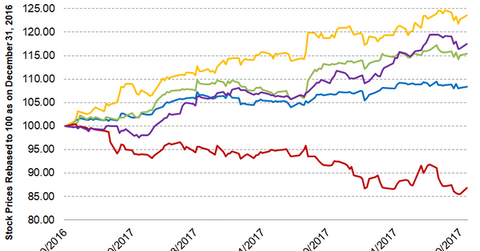
Among 3M Company’s (MMM) industrial peers, MMM stock has been the second-best performer since the beginning of 2017.
July 6 2017, Updated 7:37 a.m. ET

3M Company stock performance in 2017 so far
Among 3M Company’s (MMM) industrial peers, MMM stock has been the second-best performer since the beginning of 2017. MMM has risen 17.5%, outperforming the broad-based SPDR S&P 500 ETF (SPY), which has returned 8.4% in the same period.
MMM has also outperformed its peers Honeywell International (HON) and General Electric (GE), which have returned 15.4% and -13.1%, respectively. However, Stanley Black & Decker (SWK) has outperformed MMM with a return of 23.6%.
The strong performance of MMM stock has mainly been driven by the positive developments that have taken place during this period. MMM has acquired Scott Safety from Johnson Controls for an estimated $2.0 billion, complementing its personal safety portfolio. At the same time, it’s consolidating its portfolio from 40 businesses to 25. It has divested several businesses already, including its identity management business, its tolling and automated license/number plate recognition business, and its electronic monitoring business, to name a few.
Further, after posting solid 1Q17 earnings, MMM raised its full year GAAP (generally accepted accounting principles) EPS (earnings per share) to $8.75–$9.05 from its earlier guidance of $8.45–$8.80.
Moving average and relative strength index
MMM’s strong performance has led to its trading 7.4% above its 100-day moving average of $195.04, indicating a strong upward trend in the stock. MMM’s 52-week low is $163.85, and its 52-week high is $214.57.
MMM’s relative strength index (or RSI) of 58 indicates that the stock has been neither overbought nor oversold. An RSI of anything above 70 indicates that a stock has been overbought, and anything below 30 indicates that a stock has been oversold.
