A Look at Volatilities for Precious Metal Miners
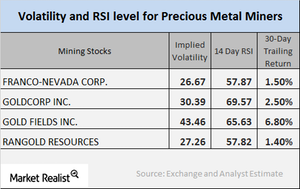
In this part of the series, we’ll look at some important technical indicators, including volatility figures and RSI levels for major miners.
July 27 2017, Updated 3:36 p.m. ET

Technical readings
Precious metal mining stocks closely follow changes in gold. However, that may not always be the case. Tuesday, July 25, 2017, was one such example. Gold fell that day, but miners got a boost. The revival of silver prices may have also played a role in the rise of some mining stocks, especially silver.
In this part of the series, we’ll look at some important technical indicators, including volatility figures and RSI levels for major miners such as New Gold (NGD), Gold Fields (GFI), Kinross Gold (KGC), and Eldorado Gold (EGO).
Implied volatility
Call-implied volatility is a tool used to measure fluctuations in an asset’s price when it comes to changes in the price of its call option. On July 25, 2017, New Gold, Gold Fields, Kinross Gold, and Eldorado Gold had implied volatilities of 43.2%, 42.8%, 44.8%, and 49.9%, respectively.
Let’s not forget that mining stocks’ volatilities are often greater than the volatilities of precious metals.
RSI
RSI (relative strength index) is a measurement tool for whether a stock has been overbought or oversold. If a stock’s RSI is above 70, it may be overbought, and its price may fall. If a stock’s RSI is below 30, it could be oversold and might correct upward.
RSI levels for the miners mentioned above have recently witnessed revivals. New Gold, Gold Fields, Kinross Gold, and Eldorado Gold have RSI levels of 57.7, 69.1, 66.1, and 40.4, respectively. There’s been a significant rebound in the prices of precious metals.
The ETFS Physical Swiss Gold (SGOL) and the ETFS Physical Silver (SIVR) are also impacted by changes in precious metal prices. These two funds have five-day trailing gains of 0.75% and 1.3%, respectively.
