A Look at Qualcomm’s Valuation
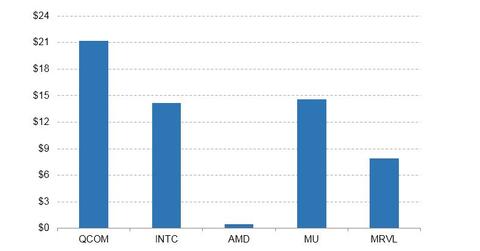
Inside Qualcomm’s price and valuation multiples Qualcomm’s (QCOM) book value per share in 2016 was ~$21.20, compared with the expected book value per share of ~$20.60 in 2017. Qualcomm shares are trading at price-to-book value of ~2.7x. In comparison, Intel’s (INTC), Advanced Micro Devices’ (AMD), Micron Technology’s (MU), and Marvell Technology’s (MRVL) book values per […]
July 16 2017, Updated 8:29 p.m. ET

Inside Qualcomm’s price and valuation multiples
Qualcomm’s (QCOM) book value per share in 2016 was ~$21.20, compared with the expected book value per share of ~$20.60 in 2017. Qualcomm shares are trading at price-to-book value of ~2.7x.
In comparison, Intel’s (INTC), Advanced Micro Devices’ (AMD), Micron Technology’s (MU), and Marvell Technology’s (MRVL) book values per share are ~$14.20, $0.44, ~$14.60, and ~$7.90, respectively. The company’s price-to-sales ratio was ~3.6x in 2016, compared with the estimated price-to-sales ratio of ~3.7x in 2017.
Examining Qualcomm’s cash flow metrics
Qualcomm has cash on hand of $9.9 billion. Its price-to-cash flow and price-to-free-cash-flow ratios are 13.6x and 33.9x, respectively. For the trailing 12 months, the company’s EV[1.enterprise value]-to-cash-flow ratio was 13.9x, and its EV-to-free-cash-flow ratio was 15.2x.
A look at Qualcomm’s EBITDA numbers
Qualcomm’s EBITDA (earnings before interest, tax, depreciation, and amortization) grew 13% to $7.5 billion last year. Analysts are expecting the company to post EBITDA of $8.2 billion. Qualcomm’s shares are changing hands at a price-to-EBITDA ratio of 11.1x.
Peers Intel, Advanced Micro Devices, Micron Technology, and Marvell Technology are trading at price-to-EBITDA ratios of 6.9x, -40.9x, 4.9x, and 19.2x, respectively.
How much debt is Qualcomm carrying?
Qualcomm is carrying a total debt of $11.9 billion, arrived at by summing its short-term debt of $1.9 billion and long-term debt of $9.9 billion. Considering that the company has a total capital of $43.3 billion, its total-debt-to-total-capital ratio comes to 27.5%. The company has debt-to-assets, debt-to-equity, and debt-to-EBITDA ratios of 0.21x, 38.1x and 1.6x, respectively.
