A Look at PayPal’s Fundamental Analysis
PayPal (PYPL) is trading at a price-to-book value of 4.4x.
July 5 2017, Updated 10:37 a.m. ET

Where do PayPal’s EBITDA and ratios stand?
PayPal’s (PYPL) EBITDA[1. earnings before interest, tax, depreciation, and amortization] margin for 2016 was 21%. This margin yielded EBITDA of $2.4 billion, which was down 16% from 2015. For 2017, Wall Street is expecting the company’s EBITDA to reach $3.3 billion.
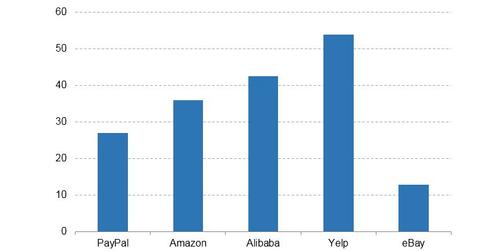
The company’s enterprise-value-to-adjusted EBITDA multiple for 2017 is expected to be 18.4x. For 2018, its EV-to-adjusted-EBITDA multiple is modeled at 15.7x. PayPal (PYPL) stock is trading at a price-to-EBITDA multiple of 27.1x.
Among PayPal’s peers, Amazon (AMZN), Alibaba (BABA), Yelp (YELP), and eBay (EBAY) are trading at price-to-EBITDA multiples of 36x, 42.5x, 53.9x, and 12.9x, respectively.
Analysis of PayPal’s price and book value figures
PayPal (PYPL) is trading at a price-to-book value of 4.4x. The stock’s price-to-sales value is 5.7x, while its price-to-estimated-sales value for 2017 is ~5.1x.
PayPal has an EV (enterprise value) of $60.4 billion, which implies that the company has a current EV-to-trailing-12-month-sales multiple of ~5.4x. The company’s EV-to-projected-sales multiple for this year is ~4.8x, while its EV-to-estimated-sales multiple for 2018 is ~4.1x.
Inside PayPal’s cash flow metrics
PayPal has $4.1 billion of cash on hand. The stock is trading at a price-to-cash-flow multiple of 20.3x and a price-to-free-cash-flow multiple of 25.9x.
The company’s trailing 12-month EV-to-cash-flow multiple is 19.1x, while its trailing-12-month EV-to-free-cash-flow multiple is 24.3x.
