Understanding the Recent Rise in Chemours Stock
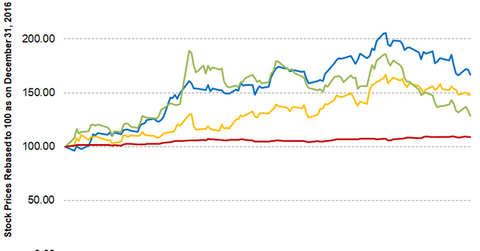
Since the beginning of 2017, Chemours (CC) stock has given a tremendous performance, gaining 66.6% YTD as of June 22.
June 27 2017, Updated 4:13 p.m. ET

Chemours stock performance
Since the beginning of 2017, Chemours (CC) stock has given a tremendous performance. Chemours has gained 66.6% YTD (year-to-date) in 2017, outperforming the SPDR S&P 500 ETF (SPY), which has returned 8.7% during the same period.
Peers Kronos Worldwide (KRO) and Tronox (TROX) have also seen solid returns of 48.40% and 28.50%, respectively, but have still underperformed Chemours.
Chemours performance has primarily been driven by its strong 1Q17 performance. The growth in prices of titanium dioxide and the continued demand for Opteon have made this possible. Notably, the demand for Opteon has been due to changes in regulations that have led to its adoption across Europe and North America.
Meanwhile, positive developments in the settling of its indemnification obligation with DuPont (DD), which involved global settlement claims related to PFOA (perfluorooctanoic acid) litigation, have also led to sharp gains in CC’s stock price.
Moving averages and RSI
Although Chemours has gained over 60% YTD, it’s only trading marginally above its 100-day moving average price of $36.75. Chemours’s 52-week low is $5.82, while its 52-week high is $46.02.
Chemours RSI (relative strength index) of 38 indicates that the stock is neither overbought nor oversold. (An RSI of 70 and above indicates that the stock is overbought while an RSI of 30 and below indicates that the stock is oversold.)
Continue reading this series (below) to learn more about CC’s current debt, its ability to service the debt, its analysts’ recommendations, and its latest valuations.
