How Walmart Compares to Its Peers
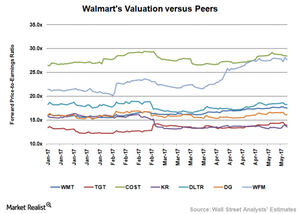
On May 12, 2017, Walmart (WMT) was trading at a 12-month forward PE multiple of 17.5x.
Nov. 20 2020, Updated 11:05 a.m. ET

Valuation summary
On May 12, 2017, Walmart (WMT) was trading at a 12-month forward PE (price-to-earnings) multiple of 17.5x. The company is currently trading at a lower PE multiple than the S&P 500 Index (SPX) and the Consumer Staples Select Sector SPDR ETF (XLP), which are trading at forward PE multiples of 18.7x and 21.1x, respectively.
In comparison, Walmart’s current valuation is lower than the peer average of 19.6x. On May 12, 2017, Target (TGT), Costco (COST), Dollar Tree Stores (DLTR), and Dollar General (DG) were trading at forward PE multiples of 13.9x, 28.4x, 18.3x, and 16.1x, respectively.
The 12-month forward PE will most likely differ among companies due to several factors, including growth expectations, leverage, profitability, business models, and risk-return profiles.
Growth expectations
Walmart is expected to report strong sales in fiscal 2018, driven by improved store performance and continued strength in its digital business. Management projects sales to rise 2.0%–3.0% in fiscal 2018. On a currency neutral basis, Walmart’s top line is projected to rise 3.0%–4.0%. Analysts on average expect the company to post a 2.0% rise in sales for fiscal 2018.
The company’s margins are likely to remain low since increased price investments, deflation in food, and adverse currency movements will continue to weigh on its results. Analysts expect the company’s bottom line to remain flat or rise marginally in fiscal 2018.
For more updates, be sure to visit Market Realist’s Mass Merchandisers page.
