Comparing MPC’s, TSO’s, VLO’s, and PSX’s Valuation
Average valuation multiples Earlier, we discussed refining stocks’ performance in 1Q17 and compared their dividend yields. In this part, we’ll look at Marathon Petroleum’s (MPC), Tesoro’s (TSO), Valero Energy’s (VLO), and Phillips 66’s (PSX) forward valuation. The average forward EV-to-EBITDA (enterprise value to earnings before interest, tax, depreciation, and amortization) multiples and average forward PE […]
Nov. 20 2020, Updated 3:49 p.m. ET

Average valuation multiples
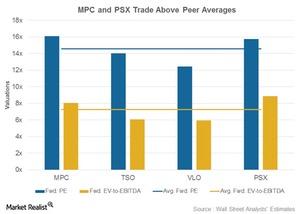
Earlier, we discussed refining stocks’ performance in 1Q17 and compared their dividend yields. In this part, we’ll look at Marathon Petroleum’s (MPC), Tesoro’s (TSO), Valero Energy’s (VLO), and Phillips 66’s (PSX) forward valuation. The average forward EV-to-EBITDA (enterprise value to earnings before interest, tax, depreciation, and amortization) multiples and average forward PE (price-to-earnings) of these refiners stand at 7.2x and 14.6x, respectively.
MPC and PSX trade at a premium
PSX trades at 8.9x forward EV-to-EBITDA multiple and 15.8x forward PE multiple, above the peer average. Marathon Petroleum also trades above average, with an 8.1x forward EV-to-EBITDA multiple and a 16.1x forward PE multiple. Why are they trading at a premium?
Phillips 66 (PSX) has a diversified earnings model aimed at shielding itself from refining volatility. It focuses on increasing its steady midstream and marketing segment earnings. Marathon Petroleum’s (MPC) strategy comprises dropping down its midstream assets to its MLP. For more on this, read MPC’s Strategic Plan to Unlock Value: What’s It All About?
TSO and VLO’s valuation
Contrarily, Valero Energy’s (VLO) and Tesoro’s (TSO) valuation ratios are lower than peers’. VLO’s forward PE multiple and forward EV-to-EBITDA multiple stand at 12.4x and 5.9x, respectively. TSO has a 14.0x forward PE multiple and a 6.1x forward EV-to-EBITDA multiple.
Tesoro likely trades at a discount to peers due to its high leverage related to the ongoing acquisition of Western Refining (WNR). TSO has a higher total debt-to-total capital ratio and leverage than VLO, MPC, and PSX.
Valero (VLO), on the other hand, is suffering due to high compliance costs associated with the purchase of RINs (renewable identification numbers), which are denting its refining earnings. In 1Q17, VLO spent $146 million on the purchase of RINs. In 2016, it spent $749 million on RINs, representing 21% of its operating margin. The expense is expected to stay at a similar level in 2017.
For small-cap stock exposure, you could consider the iShares Russell 2000 Value ETF (IWN), which has a ~5% exposure to energy sector stocks, including WNR. To learn how refining stocks’ betas are changing, continue to the next part.
