What Could Drive Schlumberger’s Performance in 1Q17 and Beyond?
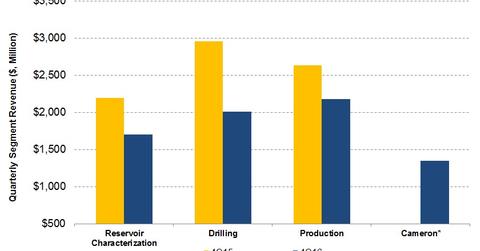
Schlumberger’s (SLB) Drilling segment witnessed the highest revenue fall of 32% in 4Q16 compared to 3Q16.
Nov. 20 2020, Updated 2:00 p.m. ET

Schlumberger’s 4Q16 revenue by segment
Schlumberger’s (SLB) Drilling segment witnessed the highest revenue fall of 32% in 4Q16 compared to 3Q16, followed by its Reservoir Characterization segment at a ~23% fall and its Production segment at a 17% fall.
In 2Q16, Schlumberger added Cameron to its product group after its acquisition of Cameron International on April 1, 2016. Schlumberger generated $1.3 billion in revenue from Cameron in 4Q16. Schlumberger accounts for 6.4% of the ProShares Ultra Oil & Gas ETF (DIG).
Schlumberger’s segment margin analysis
The Reservoir Characterization group’s 4Q16 operating income margin fell to 19% from 24% last year. The Production group’s operating margin also fell from 11% in 4Q15 to 6% in 4Q16.
The Drilling segment’s operating margin fell to 12% in 4Q16, compared to 17% in 4Q15. Read Schlumberger Receives Contracts: Will Its Valuation Change? to learn about what could drive Schlumberger’s performance in 2017.
Negative factors affecting SLB’s results
- lower activity in Schlumberger’s Cameron and Reservoir Characterization groups and a lower pricing environment for oilfield equipment and services (or OFS) companies
- sharp rig count falls in Mexico and Central America due to upstream companies’ budget constraints
- seasonal activity decline in Russia
- lower equipment sales in India
Positive factors affecting SLB’s results
- higher North American onshore drilling activity due to heavy fracking and a higher stage count
- higher sales of artificial lift products in Canada
- strong revenues from unconventional onshore activity and perforating activity in Egypt
- strong drilling and project activity in Peru, Colombia, and Ecuador as the rig count rose due to higher crude oil prices
Net income comparison
In 2016, Schlumberger’s net income was -$1.6 billion. In comparison, Weatherford International’s (WFT) reported net income was ~-$3.4 billion in 2016. Read more about WFT in Market Realist’s Will Weatherford’s Debt Repayment Plan Include Asset Sales?
In 2016, Patterson-UTI Energy’s (PTEN) net income was -$318.6 million. Energy stocks typically correlate with crude oil prices. Has SLB’s correlation with crude oil increased? Let’s find out in the next part of the series.
