Analyzing the Gold-Silver Spread as Investors Await Further Cues
When analyzing the precious metals market, it’s important to take a look at the relationship between gold (SGOL) and silver (SIVR).
April 6 2017, Updated 1:59 p.m. ET

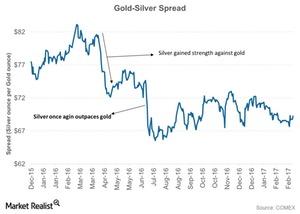
Gold-silver ratio
When analyzing the precious metals market, it’s important to take a look at the relationship between gold (SGOL) and silver (SIVR). Most of the time, gold and silver walk hand in hand. However, silver often plays the dual role of a precious metal and an industrial metal.
On April 5, 2017, gold and silver had risen 9.2% and 14.6%, respectively, year-to-date. Silver tends to be a more volatile metal than gold.
The beginning of 2017 saw some market turbulence, boosting the safe-haven appeals of precious metals. The gold-silver spread was 68.5 on April 5, 2017, suggesting that it would take almost 69 ounces of silver to buy a single ounce of gold. The peak of the gold-silver spread was close to 85 in late 2008.
Steadying ratio
The gold-silver spread has fallen drastically over the past year. On April 5, 2017, the spread’s RSI (relative strength index) was 23.8, indicating a probable rise.
The spread is also trading at a considerable discount to its 100-day moving average. This rise in the ratio suggests that it could take more ounces of silver to buy gold. Gold and silver were trading at $1,246.9 and $18.3 per ounce, respectively, on April 5.
Bull market, bear market
In a bull market for precious metals, silver usually outperforms gold, but the opposite tends to be the case in a bear market. When silver outperforms gold, the ratio falls, and when gold outperforms silver, the ratio tends to rise.
Of course, mining stocks are also affected by precious metals, especially gold and silver. Goldcorp (GG), Alamos Gold (AGI), Hecla Mining (HL), and IAMGOLD (IAG) have recovered their losses along with these precious metals.
