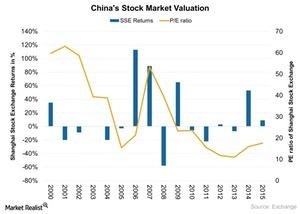
Valuations of the Shanghai Stock Exchange over the Last Decade
The main drivers of China’s (FXI) (GXC) stock market are domestic investors who make the market volatile.
Nov. 20 2020, Updated 3:43 p.m. ET

Retail investor dominance in China’s stock market
The main drivers of China’s (FXI) (GXC) stock market are domestic investors who make the market volatile. The Shanghai Stock Exchange has had significant movements over the years considering corporate performance, the dominance of retail investors, and the government’s efforts to prop up the market. Let’s look now at the valuations of China’s stock market over the last decade, which you can see in the graph below.
Valuations over the last decade
The PE (price-to-earnings) ratio of the Shanghai Index in early 2000 was high at more than 50.0x. The higher PE ratio means the index was trading at a higher premium. However, the PE ratio over the years has fallen to 17.0x as of 2015. Chinese companies experienced increased earnings due to the following:
- higher profitability with increased international trade after the WTO (World Trade Organization) agreement in 2001
- privatization of state-owned enterprises and the growth of private enterprises, which improved the labor factor productivity of the corporate sector
Comparable performance in the US market
If we compare the PE ratio of the Shanghai Index of 17.0x to the PE ratio of the S&P 500 Index (SPX-INDEX) of 20.0x as of 2015, China’s stocks seem cheaper. It could also mean that investors might not be ready to pay a premium for China’s stocks due to various reasons, including the recent slowdown in China’s economy.
Since 2000, the Shanghai Index has provided returns of more than 100.0% compared to the S&P 500 Index at ~74.0% as of 2016. However, the Shanghai Index fell in 2016 about 12.0% compared to the ~10.0% rise for the S&P 500 Index. We looked at the reasons for this poor performance in an earlier part of this series.
Performance in 2017
China’s equities are gaining momentum in 2017 with US-listed ETFs such as the KraneShares Bosera MSCI China A ETF (KBA) rising ~4.0% as of March 17, 2017. KBA offers access to A shares that track the MSCI China A International Index. Some of the holdings of KBA include Kweichow Moutai, Ping An Insurance (PNGAY), Shanghai Pudong Development Bank, and China Merchants Bank.
Domestic consumption is expected to drive the markets in 2017, with China moving from an export-based economy to a consumption-based economy.
Next, let’s look at the performance of China’s real estate sector.
