How BNSF’s Intermodal Volumes Compare in the 12th Week
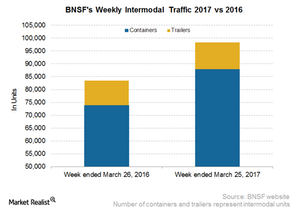
In the 12th week of 2017, BNSF Railway’s (BRK-B) overall intermodal traffic rose 17.6% YoY to more than 98,000 containers and trailers.
March 31 2017, Updated 5:35 p.m. ET

BNSF’s intermodal volumes
In the 12th week of 2017, BNSF Railway’s (BRK-B) overall intermodal traffic rose 17.6% on a YoY (year-over-year) basis to more than 98,000 containers and trailers. That compares to nearly 84,000 containers in the corresponding week of 2016. The company’s container volumes rose 19.0% to ~88,000 containers in the 12th week of 2017.
In line with containers, BNSF’s trailer volumes rose 7.0% YoY to slightly more than ~10,000 trailers. The company’s rise in intermodal traffic was far higher than the overall rise reported by US railroad companies in the same category.
Why is intermodal traffic important to BNSF?
BNSF Railway’s domestic and international intermodal operations are part of its Consumer Products Freight business. The business also includes automotive freight. This segment accounted for ~31.0% of BNSF’s total revenue in 2015.
The company’s share of Western US rail traffic in 2016 was slightly less than 50.0%. BNSF handles 1.0 million more intermodal units every year than any other Class I railroad company. Its intermodal volumes represent nearly 50.0% of its business portfolio.
BNSF’s intermodal competition
BNSF Railway faces tough competition from truckers such as JB Hunt Transport Services (JBHT) and Swift Transportation (SWFT) in the intermodal space. Intermodal volumes are impacted by seasonality, highway-to-rail conversions, and access to certain high-traffic ports.
If you’re interested in the transportation space, you could consider the WisdomTree Earnings 500 ETF (EPS). All US-born Class I railroad companies are included in its portfolio.
In the next part, we’ll take a look at the carloads of the smallest US Class I railroad company, Kansas City Southern (KSU).
