Reading the Ups and Downs of the Gold-Silver Spread
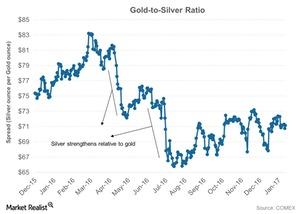
The gold-silver spread was trading at 68.5 on February 23, 2017. The spread suggests that it took 68.5 ounces of silver to buy a single ounce of gold.
Feb. 27 2017, Updated 3:10 p.m. ET

Gold-silver ratio
When analyzing the precious metals market, it’s important to take a look at the relationship between gold and silver. Most of the time, Gold (SGOL) and Silver (SIVR) move in the same direction. So far in 2017, gold and silver have risen 9.0% and 13.5%, respectively.
The last quarter of 2016 was choppy for these metals. The beginning of 2017 has seen some turbulence in the markets, thus boosting the haven appeal of precious metals.
The gold-silver spread was trading at 68.5 on February 23, 2017. The spread suggests that it took 68.5 ounces of silver to buy a single ounce of gold. The peak of the gold-silver spread was close to 85 ounces in late 2008.
The gold-silver spread has fallen drastically over the past year. As of February 16, 2017, its RSI (relative strength index) was 37.6. It’s also trading below its 20-day, 50-day, and 100-day moving averages. The RSI level of the gold-silver ratio is 30, suggesting a possible rise in the ratio.
A rise in the ratio suggests that it could take more silver ounces to buy gold. Gold and silver were trading at $1,250 and $18.10 per ounce, respectively, as of February 23, 2017.
Mean reverting
In a bull market for precious metals, silver usually outperforms gold. The opposite tends to be the case in a bear market. When silver outperforms gold, the ratio falls, and when gold outperforms silver, the ratio tends to rise. The average value of this ratio has been ~60.0 in the past 20 years.
Mining stocks are also affected by precious metals, especially gold and silver. Alamos Gold (AGI), First Majestic Silver (AG), Agnico-Eagle Mines (AEM), and AuRico Gold (AUQ) have recovered along with these precious metals.
