Analyzing How the Yield Curve Impacts Small Caps
Another factor that impacts small-cap stocks’ performance is the yield curve. The yield curve has remained on the flatter side since the recession.
Jan. 4 2017, Published 12:04 p.m. ET

Yield curve impacts small caps
Another factor that impacts small-cap stocks’ performance is the yield curve. The yield curve has remained on the flatter side since the recession due to the quantitative easing program. It bought long-dated Treasuries and yanked the yields lower. Banks (KRE) tend to lend with a long-term horizon, while their deposits have a shorter horizon. As a result, a flatter yield curve squeezes their margins.
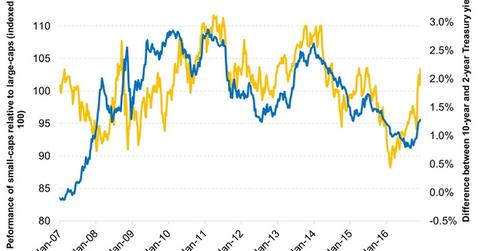
Small-cap banks make up over 20% of the Russell 2000 Index (IWM). A flatter yield curve had a bearing on small-cap performances over the years. The above graph illustrates the relationship between the performance of small caps relative to large caps and the yield curve. We used the spread between the ten-year Treasury (TLH) and the two-year Treasury (SHY) in the above graph.
The correlation between the two has been as high as 0.49 over the last ten years. Small caps have performed admirably over the last year, which was incidentally when the yield curve started expanding. The markets expect better margins for small-cap banks.
Small caps could benefit from a stronger economy
An improving economy, improving earnings, and an expanding yield curve are positive for small caps. However, higher interest rates, higher inflation rates, and lofty valuations could cause the small-cap rally to fizzle out.
While small caps may not replicate their 2016 performance next year, they will likely see mild returns due to the reasons cited throughout the series.
