What’s the Latest News on WestRock Company?
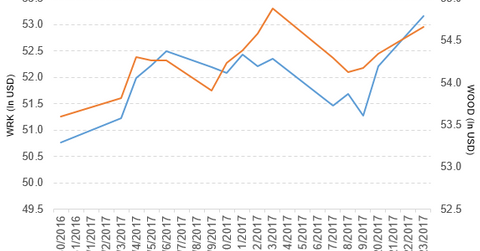
WestRock Company (WRK) has a market cap of $13.4 billion. It rose 1.8% to close at $53.16 per share on January 23, 2017.
Jan. 25 2017, Updated 9:08 a.m. ET

Price movement
WestRock Company (WRK) has a market cap of $13.4 billion. It rose 1.8% to close at $53.16 per share on January 23, 2017. The stock’s weekly, monthly, and year-to-date (or YTD) price movements were 1.6%, 1.3%, and 4.7%, respectively, on the same day.
WRK is trading 2.5% above its 20-day moving average, 4.0% above its 50-day moving average, and 19.3% above its 200-day moving average.
Related ETF and peers
The iShares Global Timber & Forestry ETF (WOOD) invests 4.0% of its holdings in WestRock. The YTD price movement of WOOD was 2.0% on January 23.
The market caps of WestRock’s competitors are as follows:
Latest news on WRK
WestRock Company released a press release on January 23, 2017, stating, “WestRock Company (WRK) announced today that it has entered into a definitive purchase agreement with Silgan Holdings Inc. (SLGN) under which Silgan will purchase WestRock’s Home, Health and Beauty business for $1.025 billion in cash plus the assumption of approximately $25 million in foreign pension liability. WestRock expects to receive net after-tax proceeds from the divestiture of approximately $1 billion.”
Performance of WestRock in fiscal 4Q16
WestRock reported fiscal 4Q16 net sales of $3.61 billion, a fall of 0.12% from the net sales of $3.62 billion in fiscal 4Q15. Sales from the Corrugated Packaging segment rose 0.83%, and sales from the Consumer Packaging segment and the Land and Development segment fell 1.2% and 2.9%, respectively, between fiscal 4Q15 and fiscal 4Q16. The company’s gross profit margin expanded 90 basis points.
Its net income and EPS (earnings per share) fell to -$92.0 million and -$0.37, respectively, in fiscal 4Q16, compared with $115.8 million and $0.44 in fiscal 4Q15. It reported adjusted EPS from continuing operations of $0.71 in fiscal 4Q16.
Fiscal 2016 results
In fiscal 2016, WRK reported net sales of 14.2 billion, a rise of 27.4% YoY (year-over-year). The company’s gross profit margin expanded 30 basis points, and its operating margin narrowed 470 basis points in fiscal 2016.
Its net income and EPS fell to -$396.3 million and -$1.54, respectively, in fiscal 2016, compared with $507.1 million and $2.93 in fiscal 2015. It reported adjusted EPS from continuing operations of $2.53 in fiscal 2016.
WRK’s cash and cash equivalents rose 64.1%, and its inventories fell 7.0% in fiscal 2016. Its current ratio fell to 1.8x, and its debt-to-equity ratio rose to 1.3x in fiscal 2016, compared with 1.9x and 1.2x, respectively, in fiscal 2015.
In the final part of this series, we’ll discuss Silgan Holdings (SLGN).
