Morgan Stanley Rated Carter’s as ‘Overweight’
On January 25, 2017, Morgan Stanley initiated the coverage of Carter’s with “overweight” rating. It set the stock’s price target at $103.0 per share.
Nov. 20 2020, Updated 4:46 p.m. ET

Price movement
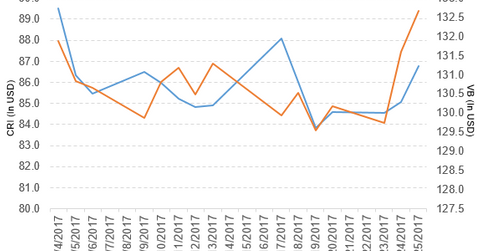
Carter’s (CRI) has a market cap of $4.3 billion. It rose 2.0% and closed at $86.79 per share on January 25, 2017. The stock’s weekly, monthly, and YTD (year-to-date) price movements were 0.92%, -1.0%, and 0.46%, respectively, as of December 23. Carter’s is trading 0.41% above its 20-day moving average, 3.2% below its 50-day moving average, and 9.7% below its 200-day moving average.
Related ETF and peers
The Vanguard Small-Cap ETF (VB) invests 0.18% of its holdings in Carter’s. VB’s YTD price movement was 2.9% on January 25.
The market caps of Carter’s competitors are as follows:
Carter’ rating
On January 25, 2017, Morgan Stanley initiated the coverage of Carter’s with “overweight” rating. It set the stock’s price target at $103.0 per share.
Performance in fiscal 3Q16
Carter’s reported fiscal 3Q16 net sales of $901.4 million—a rise of 6.1% compared to $849.8 million in fiscal 3Q15. The company’s gross profit margin rose by 80 basis points, while its operating margin fell by 80 basis points between fiscal 3Q15 and fiscal 3Q16.
Its net income and EPS (earnings per share) rose to $80.8 million and $1.60, respectively, in fiscal 3Q16—compared to $79.3 million and $1.51, respectively, in fiscal 3Q15. It reported adjusted EBITDA (earnings before interest, tax, depreciation, and amortization) and adjusted EPS of $148.9 million and $1.61, respectively, in fiscal 3Q16—a rise of 2.3% and 5.9%, respectively, compared to fiscal 3Q15.
Carter’s cash and cash equivalents fell 63.1% and its finished goods inventories rose 17.6% between fiscal 4Q15 and fiscal 3Q16.
Projections
Carter’s made the following projections for fiscal 4Q16:
- net sales growth of ~5.0%–6.0%
- adjusted EPS of $1.65–$1.70
The company made the following projections for fiscal 2016:
- net sales growth of ~5.0%–6.0%
- adjusted EPS growth of ~9.0%–10.0%
For an ongoing analysis of this sector, please visit Market Realist’s Consumer Discretionary page.
