Why Did Halliburton’s Free Cash Flow Improve?
Halliburton’s cash from operating activities (or CFO) turned positive in 3Q16.
Dec. 21 2016, Updated 9:06 a.m. ET

Halliburton’s operating cash flows and capex
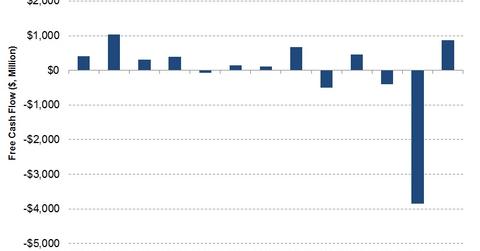
Halliburton’s cash from operating activities (or CFO) turned positive in 3Q16 compared to 2Q16. HAL’s CFO was a ~$1.0 billion in 3Q16. In 2Q16, HAL’s CFO turned negative, mainly driven by a $3.5 billion termination fee paid to Baker Hughes during the quarter. Halliburton makes up 2.5% of the iShares North American Natural Resources ETF (IGE).
Halliburton’s free cash flow
HAL’s capex fell 66% from 3Q15 to 3Q16. Lower capex coupled with remarkable improvement in CFO led to free cash flow turning positive in 3Q16. In 3Q16, HAL’s FCF was $863 million compared to -$499 million FCF a year ago. The latest quarter’s FCF was also an improvement over 2Q16 when HAL’s FCF was a -$3.9 billion. Halliburton’s FCF has been negative in four out of the past 12 quarters.
In comparison, Schlumberger’s (SLB) FCF was $1.0 billion in 3Q16. Weatherford International’s (WFT) 3Q16 FCF was -$168 million. Fairmount Santrol Holdings’ (FMSA) FCF was -$39 million in the first nine months of 2016. FMSA is Halliburton’s lower market cap peer.
Halliburton’s capex and cash flow plans for 2016
In 2016, HAL plans to spend $850 million in capex, or 61% lower than fiscal 2015. In 2016, the majority of HAL’s capex is expected to be spent on Production Enhancement, Production Solutions, Cementing (all under HAL’s Completion and Production segment), and Wireline and Perforating (under the Drilling and Evaluation segment) product service lines. HAL plans to improve earnings and working capital to achieve break-even cash flow by the end of 2016.
Next, we’ll discuss Halliburton’s dividends and dividend yields.
