Top Oilfield Service Stocks: Analyzing Implied Volatility
In this article, we’ll compare implied volatility fr the top oilfield services (or OFS) companies, as rated by Wall Street analysts, for 4Q16.
Dec. 29 2016, Updated 9:07 a.m. ET

Top oilfield service companies’ implied volatility
Implied volatility for BHI, HAL, and WFT
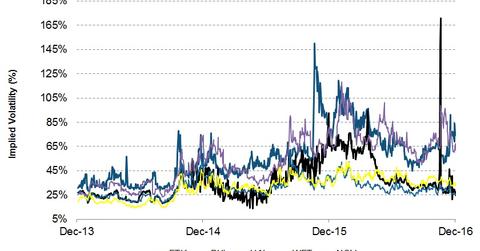
On December 23, Baker Hughes’s (BHI) implied volatility was ~30%. Since BHI’s 3Q16 financial results were announced on October 25, 2016, its implied volatility increased from ~29% to the current level. On November 1, BHI’s implied volatility shot up following the announcement of its partnership with GE (GE). Read more about the deal in Market Realist’s GE to Partner with BHI? The Changing Oilfield Services Landscape. BHI is 0.24% of the iShares Core Russell US Value ETF (IUSV). The energy sector makes up ~13% of IUSV.
On December 23, Halliburton’s (HAL) implied volatility was ~26%. Since its 3Q16 earnings were announced on October 19, 2016, Halliburton’s implied volatility fell from ~33% to the current level.
On December 23, Weatherford International’s (WFT) implied volatility was ~56%. Since its 3Q16 earnings were announced on October 25, 2016, Weatherford International’s implied volatility fell from ~72% to the current level.
What does implied volatility mean?
Implied volatility (or IV) reflects investors’ views of a stock’s potential movement. However, IV doesn’t forecast direction. Implied volatility derives from an option pricing model. Investors should note that implied volatility–suggested prices can be incorrect.
