How Monsanto’s Stock Has Tracked Its Historical Price-to-Earnings
The price-to-earnings ratio is a popular multiple investors use to determine the value of their investments in companies such as Monsanto (MON).
Dec. 30 2016, Published 1:28 p.m. ET

Valuation multiple
Valuation multiples are critical, as they’re tools investors (MOO) use to determine the prices they should pay for stocks. The PE (price-to-earnings) ratio is one of the more popular multiples investors use to determine the value of their investments in companies such as Monsanto (MON), Syngenta (SYT), FMC (FMC), and Dow Chemical (DOW).
Historical PE and stock trend
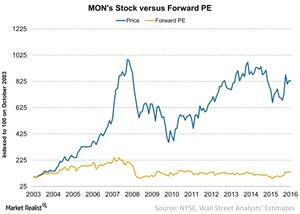
In the graph above, we’ve plotted Monsanto’s PE multiple against its stock price movement indexed to 100 since October 2003. The PE used is forward PE, which is calculated by dividing a stock’s current price by its next 12 months’ worth of earnings as estimated by Wall Street analysts.
Monsanto’s PE multiple took a dive in 2008 following the financial crisis. Let’s see how it’s traded since.
