How Has the Gold-Silver Ratio Trended in 2016?
Gold and silver have been strong for the past few days. However, silver has substantially outperformed gold year-to-date.
Dec. 15 2016, Updated 7:37 a.m. ET

Gold-silver spread or ratio
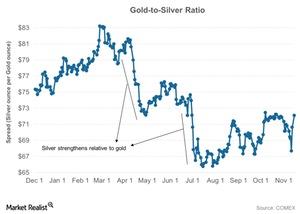
Gold and silver have been strong for the past few days. However, silver has substantially outperformed gold year-to-date. Silver has risen approximately 20%, while gold has risen nearly 10% since the beginning of 2016. The gold-silver spread, or the gold-silver ratio, is important to consider when doing a comparative study of these two precious metals. The gold-silver spread was trading at 69.8 on December 5, 2016. That ratio suggests that it takes almost 69 ounces of silver to buy a single ounce of gold.
The spread has fallen drastically since the beginning of the year. The most recent spread marked gold’s highest premium over silver since July. A decline in the spread means comparative strength for silver, as it would take fewer silver ounces to buy a single ounce of gold.
Silver overtook gold
The gold-silver spread fell to its lowest level in three decades in 2011 when gold rose to a record high. In a bull market for precious metals, silver usually outperforms gold. The opposite tends to be the case in a bear market. The spread recently rose due to a comparatively large fall in silver. Gold and silver fell 10.5% and 9.1%, respectively, on a trailing-30-day basis.
The performances of gold and silver can also affect funds such as the Physical Silver Shares (SIVR) and the Physical Swiss Gold Shares (SGOL). These two funds have seen year-to-date rises of 20.7% and 9.8%, respectively, as of December 5, 2016.
Mining stocks are also affected by precious metals, especially gold and silver. Alamos Gold (AGI), Alacer Gold (ASR), Yamana Gold (AUY), and Silver Wheaton (SLW) have also suffered over the past one month due to the decline in prices.
