How Have Tidewater’s Fundamentals Fared?
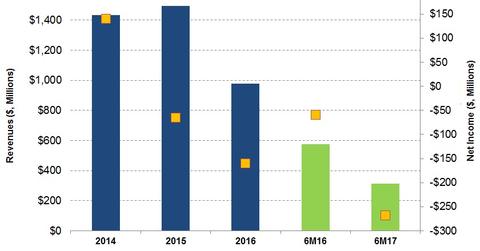
Tidewater’s net loss fell to $267.5 million in the first six months of 2017—compared to an ~$59 million net loss in the first six months of 2016.
Nov. 29 2016, Updated 1:04 p.m. ET

Tidewater’s revenues
From April 1 to September 30 this year, Tidewater’s (TDW) revenues fell 46% compared to the same period in fiscal 2016. From fiscal 2015 to fiscal 2016, Tidewater’s revenues fell 35%. In comparison, Baker Hughes’s (BHI) revenues fell 36% from 2014 to 2015.
Why did Tidewater’s revenues fall?
The primary reason why Tidewater’s revenues fell was a significant fall in the fleet utilization rate. In fiscal 2Q17, the largest fall in Tidewater’s fleet utilization was in its Asia-Pacific fleet compared to a year ago (68% versus 28%). Tidewater’s Middle East fleet was the most resilient (73% versus 64%) during the same period.
A weaker offshore energy market, following the crude oil price crash since mid-2014, prompted lower utilization and falling income for the offshore vessel industry. The day-based utilization rates measure the percentage of existing ships used in day-to-day operations. Utilization depends on the growth in the number of working deepwater rigs.
Tidewater’s net income
Tidewater’s net loss fell to $267.5 million in the first six months of 2017—compared to an ~$59 million net loss in the first six months of 2016. Its net income deteriorated primarily as a result of $129.6 million in asset impairment charges recorded in fiscal 2Q17.
From fiscal 2015 to fiscal 2016, Tidewater’s net loss rose to $160 million from a net loss of $65 million. In comparison, Schlumberger (SLB), the largest US oilfield service company in the US, recorded 62% lower net income in 2016 compared to 2015. Tidewater accounts for 0.03% of the iShares Micro-Cap ETF (IWC).
Next, we’ll discuss Tidewater’s free cash flow.
