Soybean’s Stock-to-Use Ratio Rose in October
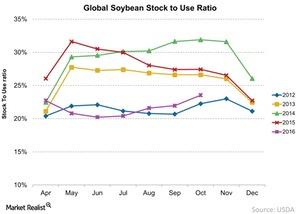
The global stock-to-use ratio for soybeans rose 1.6% to ~23.5% in October—compared to 22% in September. Soybean’s ratio is lower than last year.
Oct. 14 2016, Updated 8:04 a.m. ET

Soybean’s stock-to-use ratio
Earlier in this series, we discussed the global stock-to-use ratio for corn and how it impacted global corn prices. In this part, we’ll discuss the soybean stock-to-use ratio and how it impacted soybean prices in October.
October levels
The global stock-to-use ratio for soybeans rose 1.6% to ~23.5% in October—compared to 22% in September. Unlike corn, the global soybean stock-to-use ratio is lower compared to the global stock-to-use ratio of 27% last year.
The global soybean stock-to-use ratio was also lower compared to the past three consecutive years—as you can see in the above chart. We’ll look at the inventory numbers for deeper insight.
October inventory
Month-over-month, the soybean inventory in October 2016 rose to 77 million metric tons from 72 million metric tons in September 2016—a 7.1% increase, according to the U.S. Department of Agriculture. Compared to October 2015, the current inventory levels fell 9% from 85 million metric tons—a significant fall.
It’s important to track soybean’s stock-to-use ratio for seeds investors. About 15% of Monsanto’s (MON) revenue in 2015 came from soybean seeds and traits and ~39.7% of the revenue came from corn seeds and traits. In 2015, about 12% of Syngenta’s (SYT) revenue came from its corn and soybean seeds business.
Investors in these companies (NANR), as well as fertilizer companies such as PotashCorp (POT) and CF Industries (CF), must track these two commodities and their prices.
In the next part of this series, we’ll discuss soybean prices.
