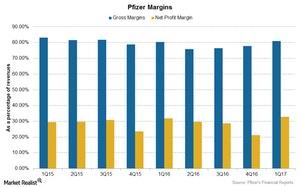
Pfizer’s Profitability in 1Q17
Pfizer’s gross margin for 1Q17 was 81.0%, a 0.70% rise compared to 80.3% in 1Q16.
June 28 2017, Updated 10:36 a.m. ET

Pfizer’s profitability
As we’ve already seen, Pfizer (PFE) reported EPS (earnings per share) of $0.69 on revenues of $12.8 billion in 1Q17. Wall Street analysts expect revenues to fall 0.60% to $13.1 billion in 2Q17 and EPS of $0.66.
The company reported a net profit of ~$3.12 billion in 1Q17 compared to $3.02 billion in 1Q16. Analysts expect a net profit of $3.15 billion in 2Q16.
The first quarter of 2017
Pfizer’s gross margin for 1Q17 was 81.0%, a 0.70% rise compared to 80.3% in 1Q16. That was mainly due to the lower cost of sales and increased revenues from products with higher profit margins. Analysts expect a gross margin of 79.3% for 2Q17.
The company’s research and development expenses fell to $1.71 billion in 1Q17 compared to $1.72 billion in 1Q16. The fall was due to lower expenses related to clinical trials and research alliances for existing drugs and drugs in the pipeline. However, research and development expenses are expected to rise to $1.78 billion in 2Q17, a 2.0% rise compared to 2Q16.
Pfizer’s EBITDA (earnings before interest, tax, depreciation, and amortization) margin rose to 53.8% in 1Q17 compared to 44.4% in 1Q16. That was due to lower research and development expenses as well as lower marketing, selling, and administrative expenses. Analysts expect the EBITDA margin to be 44.1% in 2Q17, a 3.5% fall compared to 2Q16.
To divest the company-specific risks, you can consider the VanEck Vectors Pharmaceutical ETF (PPH), which holds 4.8% of its total assets in Pfizer. PPH also holds 5.1% in GlaxoSmithKline (GSK), 5.4% in Sanofi (SNY), and 6.2% in Novartis (NVS).
