Why Did Nike Stock Fall on September 26?
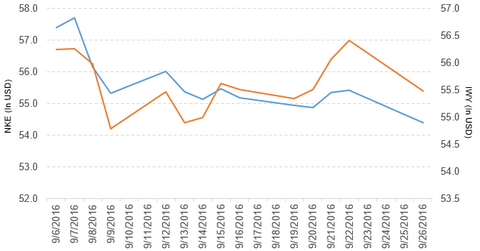
Nike (NKE) has a market cap of $91.3 billion. It fell 1.4% to close at $54.40 per share on September 26.
Nov. 20 2020, Updated 11:17 a.m. ET

Price movement
Nike (NKE) has a market cap of $91.3 billion. It fell 1.4% to close at $54.40 per share on September 26. The stock’s weekly, monthly, and year-to-date (or YTD) price movements were -1.0%, -7.9%, and -12.2%, respectively, on the same day.
NKE is trading 3.6% below its 20-day moving average, 3.9% below its 50-day moving average, and 6.6% below its 200-day moving average.
Related ETF and peers
The iShares Russell Top 200 Growth ETF (IWY) invests 1.2% of its holdings in Nike. The ETF tracks an index of US large-cap growth stocks selected from 200 of the largest US companies by market cap. The YTD price movement of IWY was 3.6% on September 26.
The market caps of Nike’s competitors are as follows:
Latest news on Nike
TheStreet reported, “The athletic footwear and apparel retailer’s Chuck Taylor sneaker reissue has slumped since its initial release last July.” Added that, “Nike issued its first major overhaul of the classic Chuck Taylor sneaker in 2015, offering it at a higher price with more padded soles, according to Bloomberg. The Chuck II is priced at as much as $110, while the original sells for around $50.”
TheStreet noted, “JPMorgan retail analyst Matthew Boss removed the stock from the firm’s ‘focus list.’”
After this news, Nike fell ~1.4% on September 26.
Performance of Nike in fiscal 4Q16 
Nike (NKE) reported fiscal 4Q16 revenues of $8.2 billion, a rise of 5.1% from $7.8 billion in fiscal 4Q15. Revenues of its footwear and apparel brands rose 6.3% and 3.9%, respectively. Revenues from equipment fell 5.8% between fiscal 4Q15 and fiscal 4Q16.
Nike’s revenues from Western Europe, Greater China, and Japan rose 18.5%, 18.1%, and 21.7%, respectively. Revenues from Central and Eastern Europe and emerging markets fell 4.2% and 6.6%, respectively, between fiscal 4Q15 and fiscal 4Q16.
Nike’s net income fell to $846.0 million in fiscal 4Q16 compared to $865.0 million in fiscal 4Q15. It reported EPS (earnings per share) of $0.49 for fiscal 4Q15 and fiscal 4Q16. In fiscal 4Q16, the company repurchased 9.0 million shares worth ~$540 million under the $12 billion share repurchase program approved by the board of directors in November 2015.
Fiscal 2016 results
In fiscal 2016, Nike (NKE) reported revenue of $32.4 billion, a rise of 5.9% year-over-year. The company’s gross profit margin rose 0.43% in fiscal 2016. Its net income and EPS rose to $3.8 billion and $2.20, respectively, in fiscal 2016, compared with $3.3 billion and $1.85, respectively, in fiscal 2015.
Nike’s cash and cash equivalents fell 18.5%, and its inventories rose 11.6% in fiscal 2016. Its current ratio and debt-to-equity ratio rose to 2.8x and 0.75x, respectively, in fiscal 2016, compared with 2.5x and 0.7x in fiscal 2015.
In fiscal 2016, Nike repurchased a total of 55.4 million shares worth ~$3.2 billion at an average price of $58.44. This repurchase took place under the old and new share repurchase programs of $8 billion and $12 billion, respectively.
On May 31, 2016, Nike scheduled the delivery of $14.9 billion in orders from June–November 2016. This translates to a rise of 8% in orders from the previous year and a rise of 11% on a currency-neutral basis.
For an ongoing analysis of the consumer discretionary sector, please visit Market Realist’s Consumer Discretionary page.
