Which US Trucking Carrier Has the Best Operating Cash Flow?
Operating cash flow is a vital parameter for judging the health of a transportation company because it points to efficiency in operating assets and liabilities.
Nov. 20 2020, Updated 1:33 p.m. ET

Trucking carriers and the trade cycle
In this part, we’ll take a deep dive into the operating cash flows of the transportation majors we’re covering in this series. You should know that a trucking carrier may have to wait 60–90 days to get paid by shippers and brokers. This prolonged cycle can affect a road transporter’s cash flow and ultimately hinder growth.
OCF (operating cash flow) is a vital parameter for judging the health of a transportation company. That’s mainly because it brings out management’s efficiency in dealing with operating assets and liabilities. To an extent, OCF determines a transporter’s ability to pour capital into fixed assets in order to drive growth.
OCF-to-revenue ratio
Usually expressed as a percentage, the OCF-to-revenue ratio compares a trucking company’s operating cash flow to its revenues. The ratio provides key insights to investors regarding a company’s ability to generate cash from its revenues. So a company’s OCF-to-revenue ratio reflects the transporter’s ability to convert its revenues into cash.
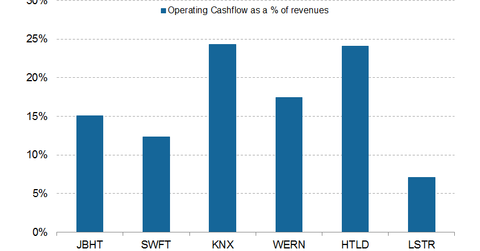
By looking at the above graph, you can see that among our companies in this series, Knight Transportation (KNX) and Heartland Express (HTLD) have the highest OCF-to-revenue ratios of 24.3% and 24.1%, respectively. This reflects better cash management on their parts.
On the other hand, Landstar System (LSTR) and Swift Transportation (SWFT) have the lowest OCF-to-revenue ratios of 7.1% and 12.3%, respectively. LSTR relies on purchased transportation services, which roughly constitute ~80% of the company’s operating costs, unlike other carriers. This lowers the company’s OCF-to-revenue ratio. However, compared to the first half of 2015, the same ratio has declined for both carriers in 2016. This certainly reflects the strain on transportation companies in the current soft-freight environment.
JB Hunt Transport Services’ (JBHT) OCF-to-revenue ratio of 15.1% is slightly below the average ratio of 16.7% for these major US trucking companies. However, given JBHT’s scale of operations and $3.1 billion in revenues in the first half of 2016, the OCF-to-revenue ratio of 15.1% is quite reasonable.
ETF investments
US major airlines and railroads make up 6.5% and 4.0%, respectively, of the iShares Global Industrials (EXI). EXI holds 1.1% and 2.1%, respectively, in global express delivery companies FedEx (FDX) and United Parcel Service (UPS).
For a sequential comparison of the financial results of these trucking companies, you can refer to Inside the Plight of Major US Truckload Carriers in 2016.
