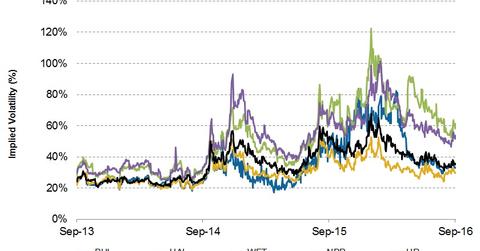
Implied Volatility: Analyzing the Top Oilfield Service Companies
On September 22, Halliburton’s implied volatility was ~28.5%. Since July 20, 2016, its implied volatility rose from ~27% to the current level.
Sept. 28 2016, Updated 11:04 a.m. ET

Top oilfield service companies’ implied volatility
In this part, we’ll discuss the implied volatility of the top OFS (oilfield services and equipment) companies, as rated by Wall Street analysts, for 3Q16. We already segregated the best and worst OFS companies by expected earnings growth in the previous parts of this series. On September 22, 2016, Baker Hughes’s (BHI) implied volatility was ~31%. Since its 2Q16 financial results were announced on July 28, 2016, its implied volatility fell from ~33% to the current level. Baker Hughes accounts for 0.20% of the iShares Core Russell US Value ETF (IUSV). The energy sector makes up 12.3% of IUSV.
On September 22, Halliburton’s (HAL) implied volatility was ~28.5%. Since its 2Q16 financial results were announced on July 20, 2016, its implied volatility rose from ~27% to the current level.
On September 22, Weatherford International’s (WFT) implied volatility was ~57%. Since its 2Q16 earnings were announced on July 27, 2016, Weatherford International’ implied volatility fell from ~74% to the current level.
On September 22, Nabors Industries’ (NBR) implied volatility was ~51%. Since 2Q16 earnings were announced on August 2, 2016, its implied volatility fell from ~58% to the current level.
On September 22, Helmerich & Payne’s (HP) implied volatility was ~32%. Since its fiscal 3Q16 financial results were announced on July 28, 2016, its implied volatility fell from ~36% to the current level.
What does “implied volatility” mean?
Implied volatility shows investors’ views regarding a stock’s potential movement. However, it doesn’t forecast direction. Implied volatility is derived from an option pricing model. Investors should note that the correctness the suggested prices can be uncertain.
