How Did Nike Perform in 1Q17?
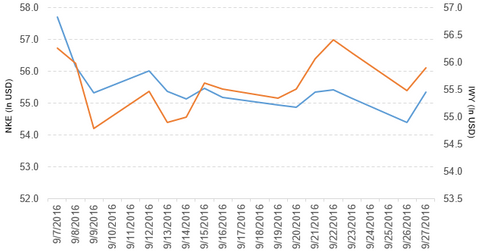
Nike (NKE) has a market cap of $92.9 billion. It rose 1.7% to close at $55.34 per share on September 27, 2016.
Nov. 20 2020, Updated 1:00 p.m. ET

Price movement
Nike (NKE) has a market cap of $92.9 billion. It rose 1.7% to close at $55.34 per share on September 27, 2016. The stock’s weekly, monthly, and year-to-date (or YTD) price movements were 0.86%, -5.9%, and -10.7%, respectively, on the same day.
NKE is trading 1.6% below its 20-day moving average, 2.1% below its 50-day moving average, and 4.9% below its 200-day moving average.
Related ETF and peers
The iShares Russell Top 200 Growth ETF (IWY) invests 0.98% of its holdings in Nike. The ETF tracks an index of US large-cap growth stocks selected from 200 of the largest US companies by market cap. The YTD price movement of IWY was 4.4% on September 27, 2016.
The market caps of Nike’s competitors are as follows:
Performance of Nike in fiscal 1Q17
Nike reported fiscal 1Q17 revenues of $9.1 billion, a rise of 8.3% compared to $8.4 billion in fiscal 1Q16. Revenues for the footwear, apparel, and equipment brands rose 6.8%, 8.9%, and 3.7%, respectively, and revenues from the global brand divisions fell 42.3% in fiscal 1Q17 compared to fiscal 1Q16.
Revenues from North America, Western Europe, Central & Eastern Europe, Greater China, and Japan rose 6.1%, 7.4%, 9.7%, 15.1%, and 36.9%, respectively, and revenues from emerging markets fell 2.2% in fiscal 1Q17 compared to fiscal 1Q16. The company’s gross profit margin fell 4.2% in fiscal 1Q17 compared to the prior year’s period.
The company’s net income and EPS (earnings per share) rose to $1.3 billion and $0.73, respectively, in fiscal 1Q17 compared to $1.2 billion and $0.67, respectively, in fiscal 1Q16.
Nike’s cash and cash equivalents fell 18.1%, and its inventories rose 10.9% in fiscal 1Q17 compared to the prior year’s period. Its current ratio fell to 2.7x, and its debt-to-equity ratio rose to 0.74x in fiscal 1Q17 compared to 2.8x and 0.61x, respectively, in fiscal 1Q16.
In fiscal 1Q17, Nike repurchased 19.0 million shares worth ~$1.1 billion. On August 31, 2016, it scheduled the delivery of $12.3 billion in orders from September 2016 to January 2017. This translates to a rise of 5% in orders from the previous year and a rise of 7% on a currency-neutral basis.
For an ongoing analysis of the consumer discretionary sector, please visit Market Realist’s Consumer Discretionary page.
