Explaining Halliburton’s Historical Valuation
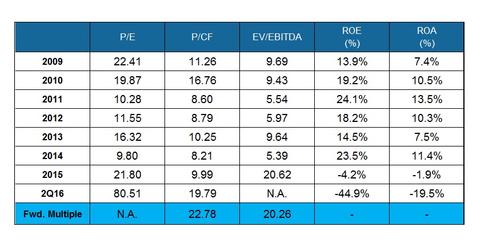
A steeper earnings decline compared to the decline in its share price caused Halliburton’s (HAL) PE multiple to expand in 2015.
Sept. 9 2016, Updated 11:04 a.m. ET

Halliburton’s PE trend
Halliburton’s (HAL) PE (price-to-earnings) multiple has fluctuated from 2009 to 2015. In 2015, adjusted earnings declined 61% over 2014. On December 31, 2015, its share price was 13% lower than a year earlier. So a steeper earnings decline compared to the decline in its share price caused HAL’s PE multiple to expand compared to 2014.
In 2Q16, Halliburton’s adjusted earnings declined compared to 4Q15, while its share price increased 33% during the same period. So its PE multiple increased sharply in 2Q16.
Forward PE considers sell-side analysts’ consensus estimate of earnings for the next four quarters. Halliburton’s forward PE isn’t meaningful, indicating negative earnings for the next four quarters.
Halliburton’s price-to-cash-flow multiple
From 2014 to 2015, Halliburton’s CFO (cash flow from operating activities) declined more sharply compared to its share price. So the PCF (price-to-cash-flow) multiple inflated in 2015 compared to 2014. Going forward, analysts expect HAL’s PCF to rise, which reflects their expectations of lower cash flow in the next four quarters.
Halliburton’s EV-to-EBITDA trend
In 2Q16, Halliburton’s enterprise value (or EV), which is approximately the sum of its equity value and net debt, increased over 4Q15. This was primarily due to a rise in its share price. However, its TTM (trailing 12-month) EBITDA (earnings before interest, tax, depreciation, and amortization) turned negative in 2Q16. So its EV-to-EBITDA multiple wasn’t meaningful in 2Q16.
In comparison, HAL’s peer Forum Energy Technologies’ (FET) EV-to-EBITDA multiple was also not meaningful in 2Q16 as a result of negative EBITDA. Halliburton makes up 2.3% of the iShares North American Natural Resources (IGE).
From 2014 to 2015, Halliburton’s EV declined. Its TTM EBITDA declined even more sharply in 2015 compared to the previous year. So Halliburton’s historical valuation, expressed as an EV-to-EBITDA multiple, increased sharply.
Forward EV-to-EBITDA considers the sell-side analysts’ consensus estimate of EBITDA for the fiscal year. Halliburton’s forward EV-to-EBITDA multiple for 2016 is slightly lower compared to 2015, reflecting marginal improvement in EBITDA in 2016 over 2015.
Next, let’s take a look at Halliburton’s valuation compared to its industry peers.
