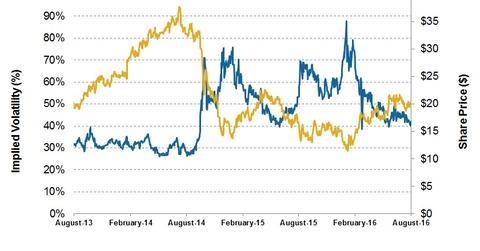
How Volatile Is Patterson-UTI Energy after 2Q16?
On August 19, Patterson-UTI Energy had an implied volatility of ~40%. Since its 2Q16 results were announced, its implied volatility has fallen from ~45%.
Aug. 30 2016, Updated 9:04 a.m. ET

Patterson-UTI Energy’ implied volatility
On August 19, 2016, Patterson-UTI Energy (PTEN) had an implied volatility of ~40%. Since PTEN’s 2Q16 financial results were announced on July 28, 2016, its implied volatility decreased from ~45% to the current level. Notably, PTEN makes up only 0.01% of the iShares Dow Jones US ETF (IYY), while the energy sector makes up 6.7% of IYY.
What does IV mean?
IV (implied volatility) reflects investors’ views of a stock’s potential movement. However, IV does not forecast direction. Implied volatility is derived from an option pricing model. Investors should note that the correctness of the implied volatility of suggested prices can be uncertain. Notably, Helix Energy Solutions Group’s (HLX) volatility on August 19 was ~71%—significantly higher than PTEN’s.
In the next and final part, we’ll discuss PTEN’s returns and analyze its strategies.
