How Traffic Growth Lags behind Capacity at Southwest Airlines
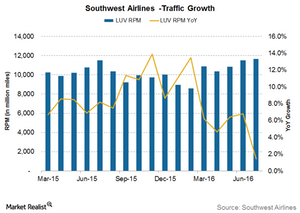
In July 2016, Southwest Airlines’ (LUV) traffic grew by 1.4% YoY, which was slightly lower than its capacity growth of 2.3% YoY.
Aug. 26 2016, Updated 3:04 p.m. ET

Traffic growth lags behind capacity
In July 2016, Southwest Airlines’ (LUV) traffic grew by 1.4% YoY (year-over-year). This rate was slightly lower than its capacity growth of 2.3% YoY. February 2016 was the only other month in 2016 when LUV’s traffic growth lagged behind capacity growth.
YTD (year-to-date) in 2016, Southwest’s traffic has increased by 6.7%—higher than its 6.1% capacity growth during the same period. For fiscal 2015, traffic increased by an average of 9% YoY, which was higher than its capacity growth of 7.3% YoY.
Remember, airline traffic is measured by RPM (revenue passenger miles). RPM is the number of revenue passengers multiplied by the total distance traveled.
Passenger travel demand
Passenger travel demand had a great start in 2016, growing by ~7% YoY—the highest rate of growth since 2012. However, the IATA (International Air Transport Association) suspects that the industry could be at the end of its traffic boost phase driven by low oil prices. This suggests that travel demand could slow down, which will adversely impact airlines.
Outlook
Despite slowing demand, LUV still has an edge over legacy carriers Delta Air Lines (DAL), American Airlines Group (AAL), and United Continental Holdings (UAL). Past trends suggest that growing GDP along with lower air fares should provide LUV with the required boost in traffic.
Notably, Southwest Airlines makes up ~1.8% of the First Trust NASDAQ Rising Dividend Achievers ETF (RDVY).
