How Are Danaher’s Returns Compared to Its Industry Peers’?
Danaher’s ROIC fell steadily from 15.5% in 2006 to 8.5% in 2015, indicating that it has probably had fewer high return reinvestment opportunities since then.
Aug. 19 2016, Updated 11:04 a.m. ET

Implications of Danaher’s falling ROIC
In the previous part of this series, we diagnosed key concerns investors might have about Danaher (DHR).
The company’s return on invested capital (or ROIC) fell steadily from 15.5% in 2006 to 8.5% in 2015, indicating that it has probably had fewer high return reinvestment opportunities since then. What does this mean?
It’s important to remember that ROIC for a particular year indicates returns on prior invested capital. However, to maintain ROIC at these levels, a company must find avenues that offer high returns on its incremental invested capital.
In our analysis of the last decade, Danaher has either overpaid for its investments or miscalculated the potential returns its investments could generate.
Therefore, investors should look at whether Danaher is capable of returning excess returns in the future after its restructuring initiatives. This can only be understood by analyzing the company’s business. We’ll look at this in the next series of our company overview, which will be published within the next three weeks.
Comparison of Danaher with healthcare equipment industry average
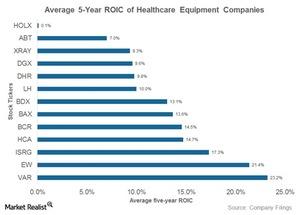
By comparison, we constructed a peer group made up of companies in the healthcare (IHF) equipment industry group in the S&P Global 1200. The market caps of companies within the list varied between $4.6 billion and $135 billion. The peer group had an average five-year ROIC of 11.4% compared to Danaher’s 9.8%.
When the list of 43 companies was ranked based on average five-year ROIC, Danaher ranked poorly at the 25th position. Among US healthcare equipment (IHI) companies, Varian Medical Systems (VAR) and Edwards Lifesciences (EW) had the highest average five-year ROICs of 23.2% and 21.4%, respectively.
Danaher was ranked 39th when compared based on its five-year average return on equity (or ROE). However, when the ROE was broken down into its components, we found that it had one of the highest profit margins and one of the lowest financial leverage figures. ROE is often distorted by excessive leverage taking, so we find it to be a less credible indicator of returns.
