Goodyear Announces New Investment Plan to Meet Demand
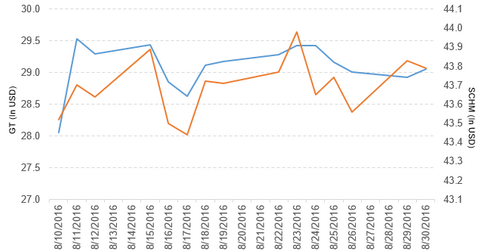
Goodyear Tire & Rubber Company (GT) has a market cap of $7.7 billion. It rose by 0.45% to close at $29.06 per share on August 30, 2016.
Aug. 31 2016, Updated 6:04 p.m. ET

Price movement
Goodyear Tire & Rubber Company (GT) has a market cap of $7.7 billion. It rose by 0.45% to close at $29.06 per share on August 30, 2016. The stock’s weekly, monthly, and year-to-date (or YTD) price movements were -1.2%, 0.97%, and -10.4%, respectively, on the day.
GT is trading 1.0% above its 20-day moving average, 5.7% above its 50-day moving average, and 1.9% below its 200-day moving average.
Related ETFs and peers
The Schwab US Mid-Cap ETF (SCHM) invests 0.27% of its holdings in GT. The ETF tracks a market cap–weighted index of mid-cap stocks in the Dow Jones US Total Stock Market Index. The YTD price movement of SCHM was 10.1% on August 30.
The SPDR S&P 500 ETF (SPY) invests 0.04% of its holdings in GT. The ETF tracks a market cap–weighted index of US large- and mid-cap stocks selected by the S&P Committee.
The market caps of GT’s competitors are as follows:
Latest news on GT
In a press release on August 30, 2016, Reuters reported, “Goodyear Thailand Pcl [GYT.BK] said on Tuesday it planned to invest $162 million to build a new radial aviation tire factory to expand production at Phathumthani, north of Bangkok, to meet growing demand in Asia Pacific.”
It also reported, “The expansion will help the tire maker capture growing demand for radial tyres as commercial airlines are rapidly converting their fleets to radial tires from bias tires, Managing Director Finbarr O’Connor said in a statement.” The report added, “The first phase of the three-phase expansion is targeted to begin operations by 2018.”
Performance of Goodyear Tire & Rubber in 2Q16
Goodyear Tire & Rubber reported 2Q16 net sales of $3.9 billion, a fall of 7.1% from its net sales of $4.2 billion in 2Q15. The company’s cost of goods sold as a percentage of net sales rose by 0.51% between 2Q15 and 2Q16.
Its net income and EPS (earnings per share) rose to $202.0 million and $0.75, respectively, in 2Q16, compared to $192.0 million and $0.70, respectively, in 2Q15. It reported adjusted EPS of $1.16 in 2Q16, a rise of 38.1% over 2Q15.
GT’s cash and cash equivalents fell by 22.9%, and its inventories rose by 9.0% between 4Q15 and 2Q16. Its current ratio rose to 1.4x, and its debt-to-equity ratio fell to 2.8x in 2Q16, compared to 1.2x and 3.0x, respectively, in 4Q15.
Projections
The company has reaffirmed its projections for 2016:
- core segment operating income growth in the range of 10%–15%, excluding Venezuela
- positive free cash flow from operations
- adjusted debt-to-EBITDAP (earnings before interest, tax, depreciation, amortization, and pension income) multiple in the range of 2.0x–2.1x at the end of the year
In the next part, we’ll discuss Under Armour (UA).
