Why Did Genesee & Wyoming’s Australian Carloads Fall in July?
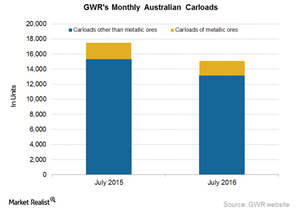
Genesee & Wyoming’s Australian carloads declined by 13.7% in July 2016, hauling more than 15,000 railcars, as compared to over 17,000 one year previously.
Nov. 20 2020, Updated 1:35 p.m. ET

Genesee and Wyoming’s Australian carloads
Genesee & Wyoming’s (GWR) Australian carloads declined by 13.7% in July 2016, hauling more than 15,000 railcars, as compared to over 17,000 one year previously.
The most noteworthy aspect of the July 2016 Australian carloads was the reduction in metallic ore carloads. On a yearly basis, these carloads declined by 11.4%. However, sequentially, the decline was substantially low. Carloads other than metallic ore fell by 14% in July 2016 on a YoY (year-over-year) basis.
Leader and laggard commodity groups
The decrease in Australian carloads in July was primarily due to the fall in agricultural carloads. Agricultural products’ carloads declined by 32.5% in July 2016. Low global crop prices along with operational issues of GWR’s agricultural products’ customers resulted in lower agricultural carloads.
Metallic ores carloads fell by 11.5%. Petroleum product carloads were down by 33.3% YoY in July 2016. Notably, not a single commodity group in the GWR’s Australian operations posted a rise in July 2016.
Carloads
For Genesee & Wyoming, the term carload represents physical railcars and estimated railcar equivalents of commodities for which the company is paid. Genesee & Wyoming is often compared with Class I railroads because its operations span 75% of the US, parts of Canada, Australia, and some parts of Europe. Other US-based Class I rail carriers include Norfolk Southern (NSC), CSX Corporation (CSX), Kansas City Southern (KSU), and Union Pacific (UNP).
Remember, the transportation and logistics sector makes up part of the industrial sector, and the ProShares Ultra S&P 500 ETF (SSO) invests ~7.6% in the industrial sector.
In this series, we’ve examined the rail traffic data of major US railroads for the 31st week of 2016, or the week ending August 6, 2016. You can compare this week’s rail data from the previous week in Inside North American Freight Traffic: Week Ending July 30.
For more information on US’s major railroad stocks, visit Market Realist’s Railroads page.
