Fiat Chrysler’s European Sales Rose in January 2018
In January 2018, Fiat Chrysler Automobiles’ (FCAU) total European sales reached ~85,000 vehicle units.
March 2 2018, Updated 9:00 a.m. ET

Fiat Chrysler’s Europe sales
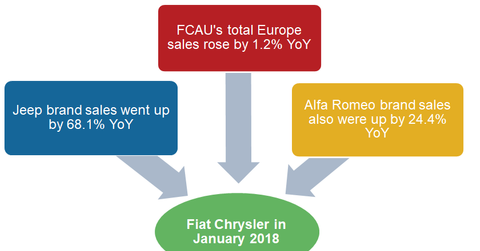
In January 2018, Fiat Chrysler Automobiles’ (FCAU) total European sales reached ~85,000 vehicle units. This reflected a minor increase of 1.2% from the company’s European market sales in January 2017.
By comparison, FCAU’s US market sales fell 13.0% YoY (year-over-year) to 133,000 vehicles in January. This was the 17th consecutive month in which the company’s total US sales witnessed a drop. Now, let’s take a closer look at some key highlights.
Fiat Chrysler Automobiles was formed in 2014 after the merger of American auto giant Chrysler and Italian auto company Fiat SpA. The Italian-American company was listed on the NYSE on October 13, 2014.
Brand-wise European sales
Fiat Chrysler offers its vehicles under five key brands in the European market: Fiat, Lancia/Chrysler, Jeep, Alfa Romeo, and Maserati.
The company’s Jeep brand vehicle sales jumped 68.1% YoY to about 12,500 units. In 2017, Jeep brand’s sales so far in the region rose 3.5% YoY to ~108,700 units.
Similarly, European sales of FCAU’s luxury car brand Alfa Romeo rose 24.4% YoY in January 2018. Last year, Alfa Romeo sales were ~85,700, up 29.5% YoY.
Lancia/Chrysler and Fiat brands’ January 2018 sales in Europe also stood firm at 4,900 and 59,900 units, respectively.
FCAU’s profit margins have gone up significantly in the last seven consecutive quarters. Despite this positive trend in profits, Fiat Chrysler’s profitability was still lower than its peers (VCR) Ford (F), General Motors (GM), and Toyota (TM).
FCAU’s higher operations costs and worse manufacturing efficiencies were two of the key reasons for its lower profit margins earlier, which the company has improved in recent quarters.
In the final part, we’ll see how Ford’s January 2018 sales were in Europe.
