Why Did Delphi Automotive Partner with Mobileye?
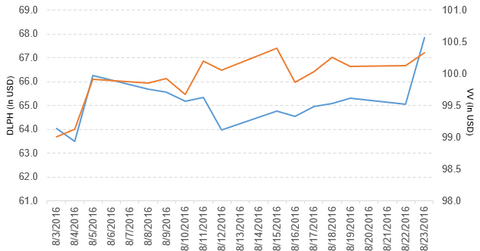
Delphi Automotive (DLPH) has a market cap of $18.5 billion. It rose by 4.3% and closed at $67.86 per share on August 23, 2016.
Nov. 20 2020, Updated 2:23 p.m. ET

Price movement
Delphi Automotive (DLPH) has a market cap of $18.5 billion. It rose by 4.3% and closed at $67.86 per share on August 23, 2016. The stock’s weekly, monthly, and YTD (year-to-date) price movements were 5.2%, -0.27%, and -19.8%, respectively, on the same day. Delphi Automotive is trading 3.3% above its 20-day moving average, 3.7% above its 50-day moving average, and 4.4% below its 200-day moving average.
Related ETF and peers
The Vanguard Large-Cap ETF (VV) invests 0.09% of its holdings in Delphi Automotive. VV tracks a market-cap-weighted index that covers 85% of the market capitalization of the US equity market. VV’s YTD price movement was 8.3% on August 23.
The market caps of Delphi Automotive’s peers are as follows:
Latest news 
Delphi Automotive and Mobileye (MBLY) entered into a partnership to develop a complete SAE level 4/5 automated driving solution.
Delphi Automotive reported, “The program will result in an end-to-end production-intent fully automated vehicle solution, with the level of performance and functional safety required for rapid integration into diverse vehicle platforms for a range of customers worldwide. The partners’ Central Sensing Localization and Planning (CSLP) platform will be demonstrated in combined urban and highway driving at the 2017 Consumer Electronics Show in Las Vegas and productivity ready for 2019.”
Performance of Delphi Automotive in 2Q16
Delphi Automotive reported 2Q16 net sales of $4.2 billion—a rise of 7.7% from net sales of $3.9 billion in 2Q15. Sales of the Electrical and Electronic Architecture and Electronics and Safety segments rose by 15.1% and 9.0%, respectively. Sales of the Powertrain Systems segment fell by 2.2% between 2Q15 and 2Q16. It reported a restructuring expense of $154.0 million in 2Q16—compared to $17.0 million in 2Q15. The company’s cost of sales as a percentage of net sales and operating income fell by 1.2% and 18.7%, respectively.
Its net income and EPS (earnings per share) fell to $258.0 million and $0.94, respectively, in 2Q16—compared to $645.0 million and $2.23 in 2Q15. It reported adjusted EPS of $1.59 in 2Q16—a rise of 18.7% from 2Q15.
Delphi’s cash and cash equivalents fell by 18.3% and its inventories rose by 11.6% between 4Q15 and 2Q16. Its debt-to-equity ratio fell to 3.3x in 2Q16 from 3.4x in 4Q15. It reported a current ratio of 1.3x in 4Q15 and 2Q16. During 2Q16, the company repurchased 0.89 million shares worth ~$65 million. Currently, it has ~$1.6 billion for future share repurchases.
Projections
The company made the following projections for fiscal 3Q16 and fiscal 2016:
Fiscal 3Q16
- revenue of $3.9 billion–$4.0 billion
- adjusted operating income of $505 million–$525 million
- adjusted EPS of $1.38–$1.44
- adjusted effective tax rate of 17%
Fiscal 2016
- revenue of $16.3 billion–$16.5 billion
- adjusted operating income of $2.15 billion–$2.20 billion
- adjusted EPS of $5.95–$6.05
- cash flow from operations of $1.9 billion
- capital expenditures of $750 million–$800 million
- adjusted effective tax rate of 17%
For an ongoing analysis of this sector, please visit Market Realist’s Consumer Discretionary page.
