Visteon Acquires AllGo Embedded Systems
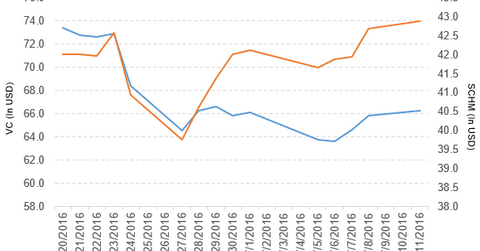
Visteon (VC) has a market cap of $2.5 billion. It rose by 0.59% to close at $66.23 per share on July 11, 2016.
July 12 2016, Published 2:42 p.m. ET

Price movement
Visteon (VC) has a market cap of $2.5 billion. It rose by 0.59% to close at $66.23 per share on July 11, 2016. The stock’s weekly, monthly, and year-to-date (or YTD) price movements were 0.18%, -11.1%, and -42.2%, respectively, that day. VC is trading 4.3% below its 20-day moving average, 8.4% below its 50-day moving average, and 25.4% below its 200-day moving average.
Related ETFs and peers
The Schwab US Mid-Cap ETF (SCHM) invests 0.17% of its holdings in Visteon. The ETF tracks a market-cap-weighted index of mid-cap stocks in the Dow Jones US Total Stock Market Index. The YTD price movement of SCHM was 7.8% on July 11.
The iShares Dow Jones US ETF (IYY) invests 0.02% of its holdings in Visteon. The ETF tracks a broad, cap-weighted index of US companies covering 95% of the US market.
The market caps of Visteon’s competitors are as follows:
Visteon acquires AllGo Embedded Systems
Visteon has completed the acquisition of AllGo Embedded Systems, a supplier of embedded multimedia and smartphone connectivity software solutions. It will acquire AllGo’s technology assets, automotive business, and ~140 employees.
The company stated that “the business acquired from AllGo supports Visteon’s global vehicle cockpit electronics business and enables Visteon to offer a highly integrated solution to automakers that includes multimedia software and codecs, and smartphone connectivity features.”
Visteon’s performance in fiscal 1Q16
Visteon reported fiscal 1Q16 sales of $802.0 million, 1.7% lower than the $816.0 million seen in fiscal 1Q15. The company’s cost of sales as a percentage of sales fell by 1.5% between fiscals 1Q15 and 1Q16. It reported restructuring expenses of $10 million, compared with $3 million in fiscal 1Q15.
Net income and EPS
VC’s net income and EPS (earnings per share) fell to $19 million and $0.49 in fiscal 1Q16, respectively, from $50.0 million and $1.10 in fiscal 1Q15. Visteon’s cash and cash equivalents and inventories fell by 70.6% and 2.7%, respectively, between fiscals 4Q15 and 1Q16. Its current ratio rose to 1.9x and its DE (debt-to-equity) ratio fell to 2.2x, compared with 1.5x and 2.9x, respectively, in fiscal 4Q15. During fiscal 1Q16, the company repurchased 1.6 million shares worth $105 million under a share repurchase agreement.
Projections
Visteon has made the following projections for its Electronics Product Group in fiscal 2016:
- sales of $3.2 billion
- adjusted EBITDA (earnings before interest, tax, depreciation, and amortization) of $305 million–$335 million
- adjusted free cash flow of $110 million–$150 million
In the next and final part of the series, we’ll take a look at PepsiCo.
