How Did BNSF’s Intermodal Volumes Fare?
BNSF Railway’s (BRK-B) total intermodal traffic for the week ended July 2, 2016, was up 1.7%.
Nov. 20 2020, Updated 4:45 p.m. ET

BNSF’s intermodal volumes
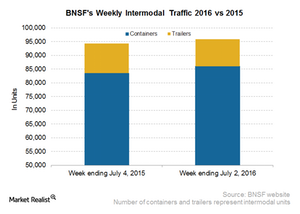
BNSF Railway’s (BRK-B) total intermodal traffic for the week ended July 2, 2016, was up 1.7%. From nearly 94,000 containers and trailers in the comparable week of 2015, intermodal traffic rose to ~96,000 containers and trailers in the reported week of 2016.
In the same week, container traffic was up 2.9% on a year-over-year basis to 86,000 from ~84,000 in the week ended July 4, 2015. Trailer traffic fell 8.6% for the week ended July 2, 2016, to ~10,000 trailers from nearly 11,000 trailers in the corresponding week in 2015.
Why does intermodal matter for BNSF?
BNSF Railway’s domestic and international intermodal operations are part of the consumer products freight business. This business also includes automotive freight . This business segment accounted for ~31% of BNSF’s total revenues in 2015.
The company’s share of Western US rail traffic in 2015 was ~50%. In addition, the company handles one million more intermodal units every year than any other Class I railroad. Intermodal represents nearly 50% of BNSF’s business portfolio by volume.
If we compare intermodal’s share to revenues with other Class I carriers, then BNSF Railway’s intermodal accounts for the largest share of total revenues. This major carrier’s intermodal segment faces strong competition from Union Pacific (UNP), another dominant railroad in the region.
BNSF’s intermodal competition
BNSF Railway also faces tough competition from truckers like J.B. Hunt Transport (JBHT) and Swift Transportation (SWFT) in the intermodal space. Intermodal volumes, apart from seasonality, are also affected by highway-to-rail conversions and the carrier’s exclusive access to certain high traffic ports.
Investors who want exposure to the transportation space can invest in the Wisdom Tree Earnings 500 Fund ETF (EPS). All the US-born Class I railroads are part of EPS’s portfolio holdings.
You can compare this week’s rail data with data from the previous week in Why the Week Ending June 25 Was a Mixed Bag for Rail Traffic. For more information on major US railroad stocks (IYT), visit Market Realist’s railroads page.
In the next part, we’ll go through the carloads of the US’s smallest Class I railroad, Kansas City Southern.
