Why Did Hershey’s Stock Rise on June 30?
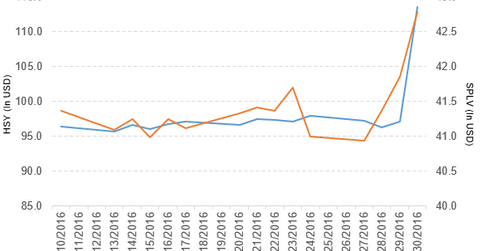
The Hershey Company (HSY) has a market cap of $24.2 billion. Its stock rose by 16.8% to close at $113.49 per share on June 30, 2016.
Nov. 20 2020, Updated 2:47 p.m. ET

Hershey’s stock price movement
The Hershey Company (HSY) has a market cap of $24.2 billion. Its stock rose by 16.8% to close at $113.49 per share on June 30, 2016. The stock’s weekly, monthly, and YTD (year-to-date) price movements were 16.9%, 22.0%, and 28.8%, respectively, on the same day. HSY is trading 18.3% above its 20-day moving average, 21.8% above its 50-day moving average, and 26.3% above its 200-day moving average.
Related ETFs and peers
The PowerShares S&P 500 Low Volatility Portfolio (SPLV) invests 0.95% of its holdings in Hershey. The ETF tracks a volatility-weighted index of the 100 least volatile stocks in the S&P 500. The YTD price movement of SPLV was 12.2% on June 30.
The iShares MSCI USA Quality Factor ETF (QUAL) invests 0.95% of its holdings in Hershey. The ETF tracks an index of US large- and mid-cap stocks, selected and weighted by high return on equity, stable earnings growth, and a low debt-to-equity ratio, relative to peers in each sector.
The market caps of Hershey’s competitors are as follows:
Hershey rejected Mondelez International’s offer
In a press release on June 30, 2016, Hershey stated, “The Hershey Company (HSY) today confirmed that it had received a preliminary, non-binding indication of interest from Mondelez International (MDLZ) to acquire the company for a mix of cash and stock consideration, totaling $107 a share of Hershey common stock. The indication of interest also included other non-monetary considerations.”
Hershey rejected this $23 billion offer from Mondelez International. This transaction would have expanded Mondelez International’s business and created the largest confectioner.
Hershey’s performance in 1Q16
Hershey (HSY) reported 1Q16 net sales of $1.8 billion, a fall of 5.6% from net sales of $1.9 billion in fiscal 1Q15. It reported business realignment charges of $6.1 million in 1Q16, against $2.7 million in fiscal 1Q15.
From 1Q15 to 1Q16, due to the implementation of productivity and cost-saving initiatives, the company saved $16.6 million in unallocated adjusted corporate expenses.
Hershey’s net income and EPS (earnings per share) fell to $229.8 million and $1.06, respectively, in 1Q16, compared with $244.7 million and $1.10 in 1Q15.
From 4Q15 to 1Q16, Hershey’s cash and cash equivalents fell by 17.5%, and its inventories rose by 2.6%. Its current ratio fell to 0.76x, and its debt-to-equity ratio rose to 5.0x in 1Q16, as compared to 0.83x and 4.1x, respectively, in 4Q15.
Projections
Hershey (HSY) has made the following projections for 2016:
- net sales growth of ~1.5%, which includes a net benefit from acquisitions and divestitures of about 0.5%
- net sales growth of 2.5% on a constant-currency basis due to the unfavorable impact of ~1% from foreign currency exchange translation
- reported EPS in the range of $4.16–$4.23
- adjusted EPS in the range of $4.24–$4.28, including the barkTHINS dilution of $0.05–$0.06 per share
For an ongoing analysis of this sector, please visit Market Realist’s Consumer Discretionary page.
